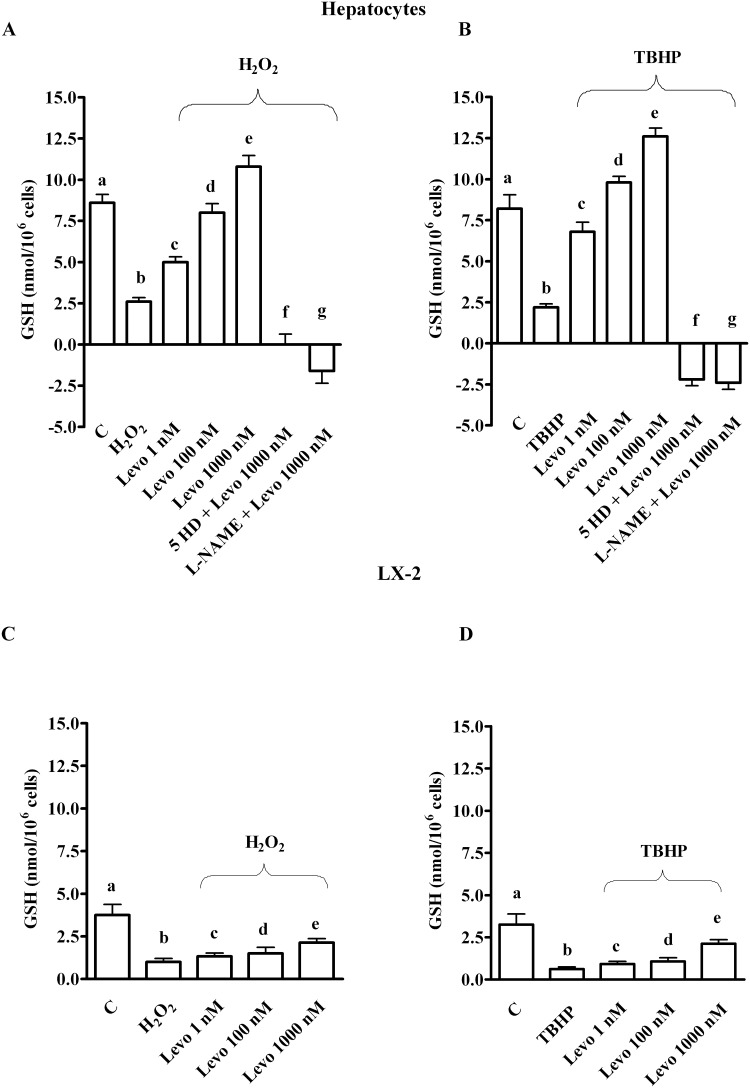
Fig 3. Effects of levosimendan on glutathione content in hepatocytes and LX-2.
In A and B, b, c, e, f, g P<0.05 vs a; c, d, e, f, g P<0.05 vs b; d, e P<0.05 vs c; d, f, g P<0.05 vs e. In C and D, b, c, d P<0.05 vs a; e P<0.05 vs b. In D, e P<0.05 vs c, d. GSH = glutathione. Other abbreviations are as in Figs 1 and 2. The results obtained in hepatocytes and LX-2 are expressed as means of 5 or 4 independent experiments (%) ± SD (indicated by the bars), respectively.

