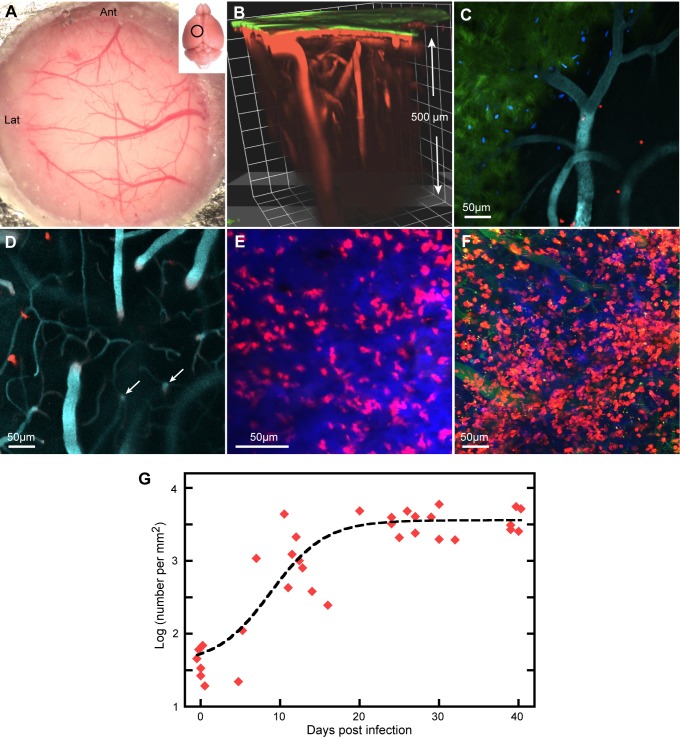
Fig 1. Peripheral infection increases the number of T cells in the meninges.
A. The thinned skull, showing parts of the metal plate surrounding the 5 mm hole. Generally, arteries arrive from the left, veins leave to the right. Inset: the approximate position of the area imaged. B. 3D reconstruction from a Z-stack showing the skull (green) and larger blood vessels, horizontal in the meninges and vertical in the brain parenchyma. C. Z-projection 30 μm thick in an uninfected mouse showing sparse CD2+ cells (DsRed) close to the skull. The skull is slightly inclined to the XY plane and is seen in green to the lower left. Cell nuclei labeled by i.v. injection of furamidine are blue. Blood vessels (cyan) are labeled with quantum dots. D. At deeper levels, surface vessels turn downwards and vertical vessels in the parenchyma are visible (arrows). Three T cells are at about the level of the horizontal vessel. This is another 20 μm Z-projection of the same XY field as (C). E,F. Deep Z-projections (143 μm and 188 μm respectively) at 7 dpi (E) and 39 dpi (F), showing increased numbers of T cells. The blue in (E) is from the skull. Blood vessels in (F) are green. G. Numbers per mm2 of meningeal T cells plotted on a log scale against dpi. Each symbol corresponds to one mouse. The dashed line is a fitted sigmoid.

