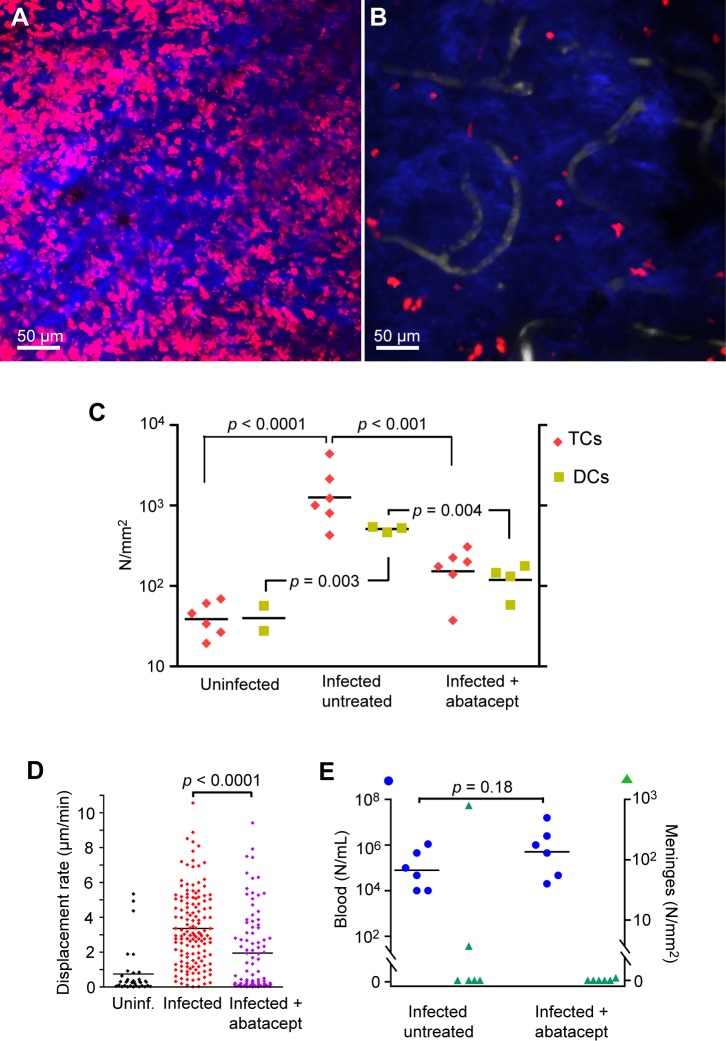
Fig 7. Abatacept reduced the increase in meningeal T cells.
A. CD2+ (DsRed) cells in the meninges at 11 dpi, untreated control. Z-projection, 15 μm. Blue from SHG indicates the proximity of the skull. B. A companion mouse treated with abatacept. C. Numbers of meningeal T cells and dendritic cells, in uninfected controls, and untreated and treated mice at 11–12 dpi. Each symbol is the mean for several fields for one mouse. p values were calculated by Student's t test after log transformation. D. Mean speeds of T cells in three untreated and three treated mice. E. Parasitemia (blue) and numbers of meningeal trypanosomes (green) in infected mice at 11–12 dpi without or with abatacept treatment. Each symbol corresponds to one mouse.

