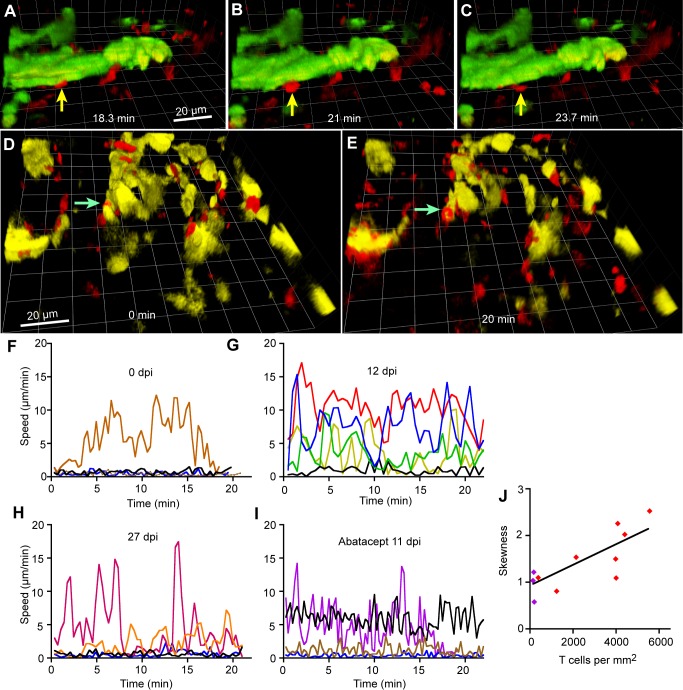
Fig 8. T cells contacted dendritic cells in the meninges.
A-C. A T cell that made contact with a dendritic cell for 5.4 min. During 25 min of imaging, the T cell indicated by the arrow contacted a dendritic cell (green, part of an agglomeration) at 18.3 min (A) remained in place (B), and left at 23.7 min (C). 25 dpi. D,E. A T cell (arrow, red) that remained in contact with a dendritic cell (yellow) throughout 20 min of imaging (S13 Video). 25 dpi. Both scale bars 20 μm. F-I. Illustrative plots of T cell speed changing with time. J. The mean skewness of the distribution of speed about the mean speed of at least 10 tracks per mouse was calculated and plotted against the number of T cells in the dura. Each symbol corresponds to one mouse. Purple symbols indicate three mice treated with abatacept.

