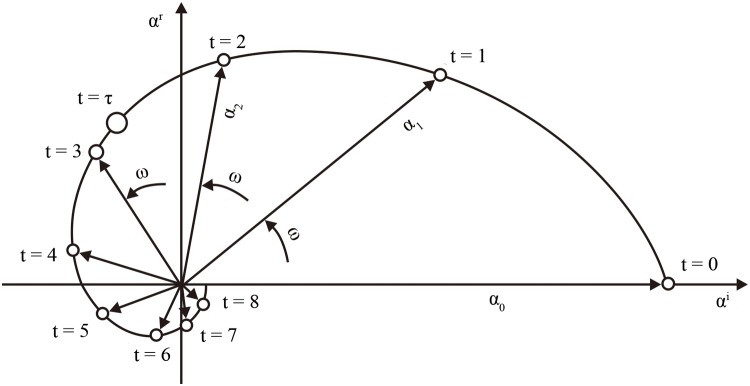
Fig 2. Schematic diagram of the time evolution of POP coefficients α t(k) with an initial value α 0 = (α r, α i) = (0,1) (From [19]).

The complex number α t rotates in slightly more than eight time steps anticlockwise once around the origin. ω is a constant angle in the complex plane. The e-folding time τ, for which |α τ| = 1/e is marked by an open circle. The amplitude |α t|, in the perspective of epidemiology, corresponds to magnitude of schistosomiasis risk in our study.
