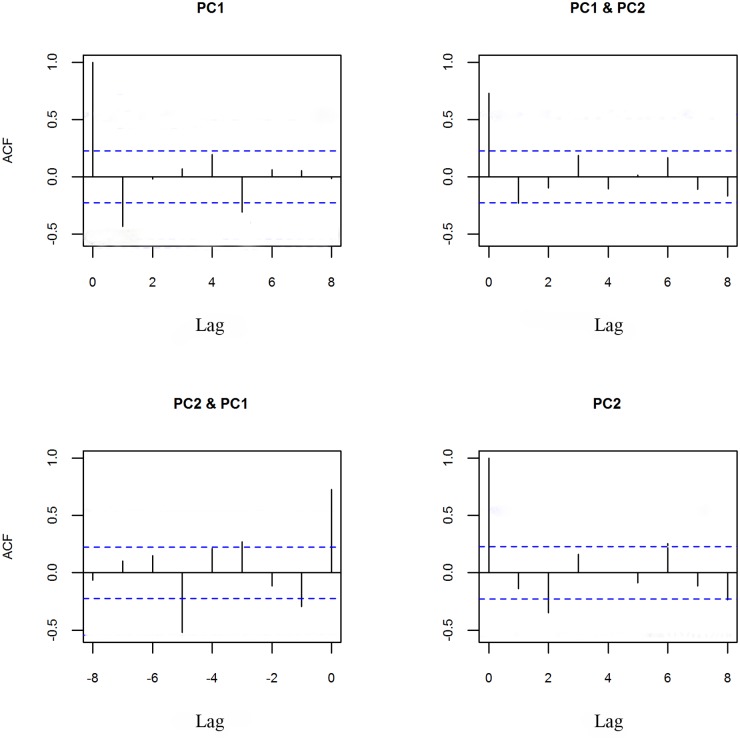
Fig 5. Correlation of residuals from the formula (1).
Top left: autocorrelation for PC1; Top right: cross-correlation between PC1 and PC2 (positive lag); Bottom right: cross-correlation between PC1 and PC2 (negative lag); Bottom right: autocorrelation for PC2. Horizontal dashed lines represent 95% confidence levels for correlation of white noise realizations. Lags are spaced by one year.

