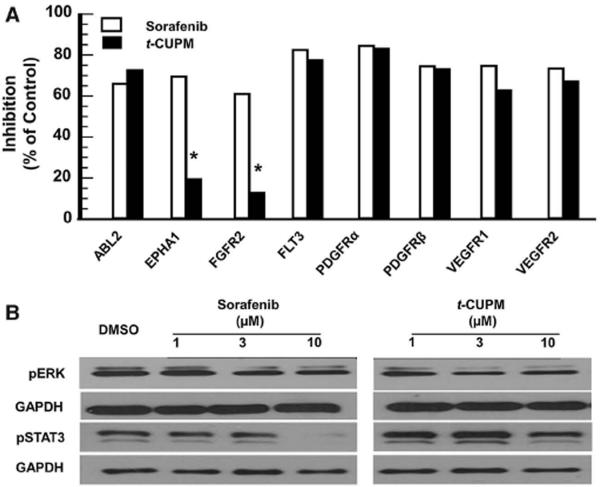
Fig. 2.
Comparison of the kinase inhibitory profile of sorafenib and t-CUPM. a Selected kinase targets of sorafenib were screened for inhibition at 10 μM test concentrations. Data were collected from a 2-point kinase screen, limiting statistical analysis calculations. However, a change in inhibition of >40 % is deemed significant for these data. b Comparison of sorafenib and t-CUPM on the suppression of the RAF/MEK/ERK and JAKs/STAT3 signaling pathways using western blot analysis. HepG2 cells were exposed to compounds for 24 h at indicated concentrations. Note that the apparent suppression of total ERK by sorafenib is considered an artifact

