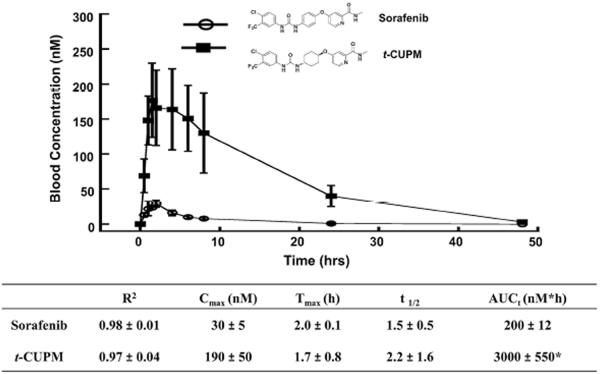
Fig. 6.
Comparison of the pharmacokinetic profiles of sorafenib and t-CUPM. PK study was performed by cassette oral administration at a dose of 1 mg/kg (n = 3) in mice. R2 is the square of the correlation coefficient between predict and observed value; Tmax the time of maximum concentration, Cmax the maximum blood concentration, t1/2 half-life, and AUCt area under the concentration–time curve to terminal time. *P value < 0.05 as compared to the AUCt of sorafenib

