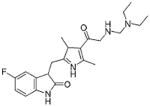
Table 1.
Comparison of half-maximum effective concentration (EC50) values (μM) on the cell viability of various cancer cell lines
| Compound name | Structures | EC50 (μ,M)a |
|||||
|---|---|---|---|---|---|---|---|
| Liver |
Kidney | Prostate | Breast |
||||
| HepG2 | Huh-7 | ACHN | PC-3 | T47D | SKBR3 | ||
| Sorafenib |
|
4.5 ± 0.7 | 4.2 ± 0.5 | 4.0 ± 0.5 | 5.5 ± 0.8 | 3.0 ± 0.5 | 6.5 ± 0.5 |
| t-CUPM |
|
7.0 ± 0.7 | 8.0 ± 0.6 | 7.5 ± 0.7 | 7.0 ± 1.0 | 5.0 ± 0.8 | 7.0 ± 5.0 |
| Sunitinib |

|
7.5 ± 0.8 | 8.0 ± 0.9 | 8.0 ± 1.0 | 8.0 ± 0.5 | 12.0 ± 1.0 | 10.0 ± 0.9 |
Data presented as mean standard deviation
Cell viability was determined using MTT assay after 72-h treatment and performed in 96-well plates with 10,000 cells/well
