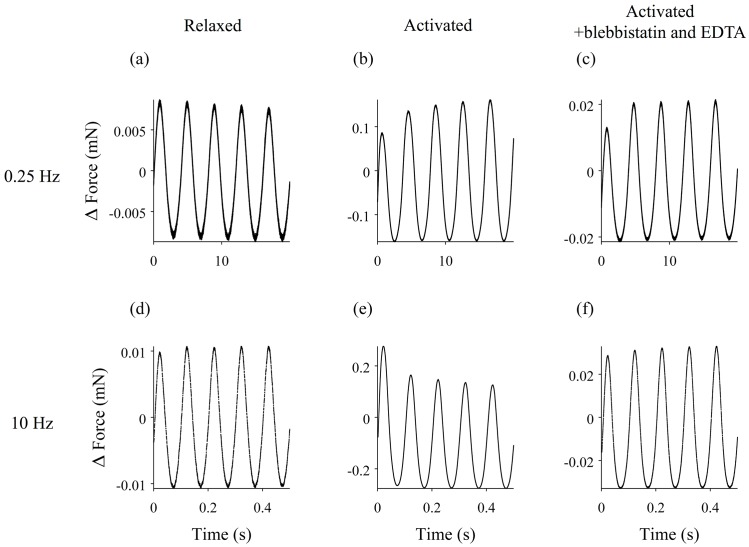
Fig 1. Length change and force response of a muscle fiber experiencing driving sinusoidal oscillations.
Length changes are shown in black, and the force response is in red. The mean force and length have been subtracted from the traces. 0.25 Hz oscillations of (a) the relaxed fiber, (b) the activated fiber, and (c) the activated fiber following treatment with EDTA and blebbistatin. 10 Hz oscillation of (d) the relaxed fiber, (e) the activated fiber, and (f) the activated fiber following treatment with EDTA and blebbistatin. The length of the fiber was 2.6 mm.

