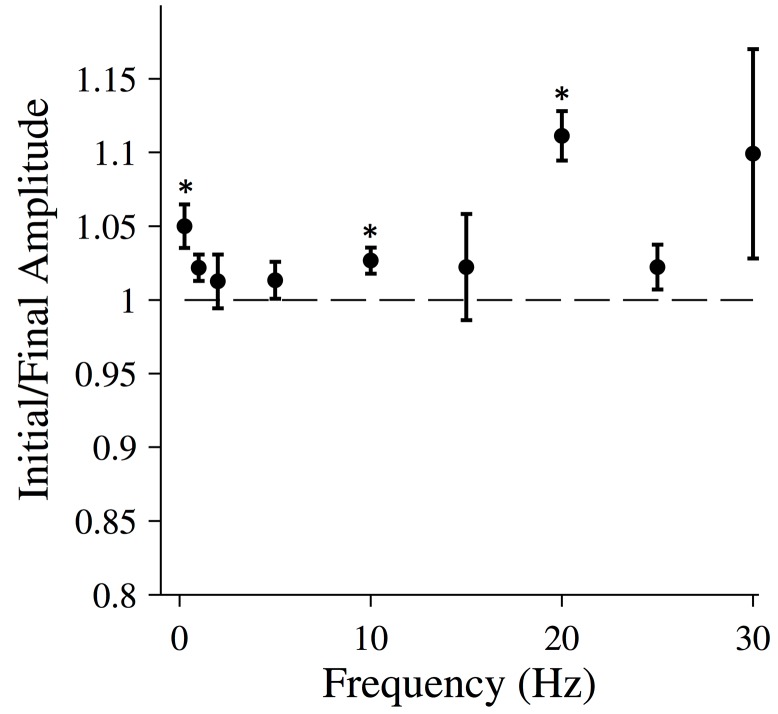
Fig 3. Changing force response for relaxed muscle fibers.
The ratio of the initial and final RMS amplitudes for relaxed muscle fibers. The total length of the oscillation was 20 seconds. All data points are (MEAN±SEM), and the number of fibers analyzed was N = 6. A one-sample t-test was used to test the null hypothesis that data collected at each frequency comes from a normal distribution with mean equal to 1. For data points marked with an asterisk, the null hypothesis was rejected (p<0.05).

