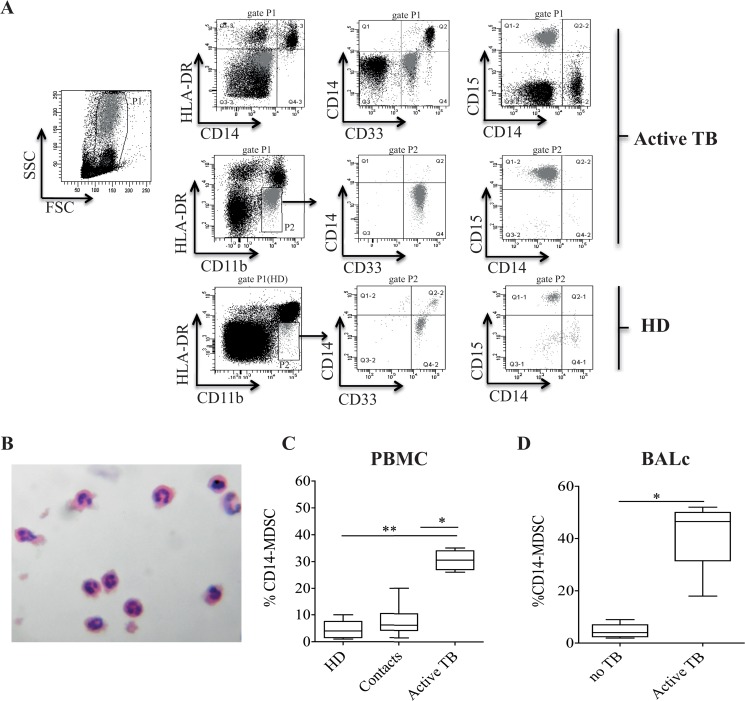
Fig 1. Frequency of granulocytic MDSCs in BALc and peripheral blood of active TB patients and HD.
(A) Gating strategy used to analyze the frequency of MDSCs, and dot plots showing CD14 expression on cells from P1, bringing to front cells in P2 (MDSCs, gray). (B) MDSCs obtained by sorting were examined by light microscopy. Morphologic analyses of peripheral MDSCs showed substantial homogeneity, comprised only of subset exhibiting granulocytic characteristics. (C) MDSC frequency in PBMCs derived from healthy donors (N.15), contact TB (N.12) and active TB (N.30). (D) Frequency of MDSCs in BALc derived from TB patients (N.30) and individuals with pulmonary diseases not correlated with TB (No TB, N.8). Results are expressed as the median ± IQR. *P<0.05, **P<0.02.

