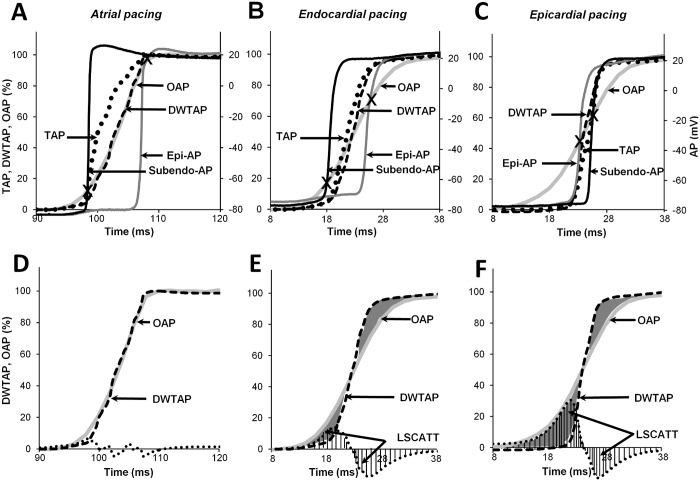
Fig 4. Influence of DWTAP and LSCATT on the OAP upstroke.
(A-C) Traces of all upstrokes obtained for atrial/endo-/epi-pacing: simultaneous recordings of a subendo-AP (black line), epi-AP (gray line), and an OAP (light gray line) compared with the calculated TAP (dot line) and DWTAP (dashed line) signals. (D-F) Comparison of the OAP and DWTAP (same as in A-C). The difference between these signals provided the LSCATT (gray area); for better visualization, this LSCATT is also shown along the x-axis (dashed area).Note that a positive peak and a negative peak indicate an oncoming and receding wave, respectively, induced by LSCATT only when stimulated at the endo- or epicardium but not when stimulated at the atrium. DWTAP and LSCATT coexist around the mid-part of the OAP upstroke.

