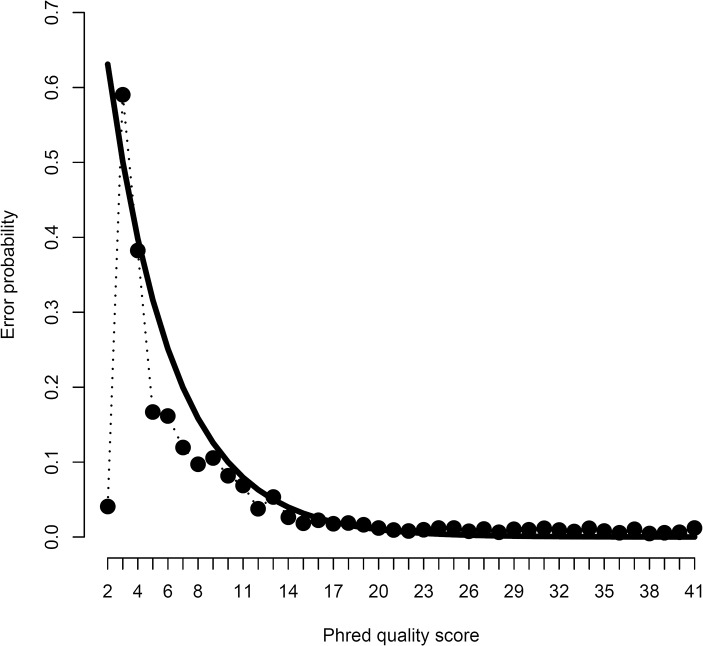
Fig 1. Sequencing error probabilities.
Observed sequencing error probability as a function of the Phred quality score (dots connected by the dotted line) and the expected error probability according to the expression 10(−QS /10), where QS represents the quality score (solid line). There is overall agreement between empirical observations and theoretical expectation, expect for the quality score of 2.

