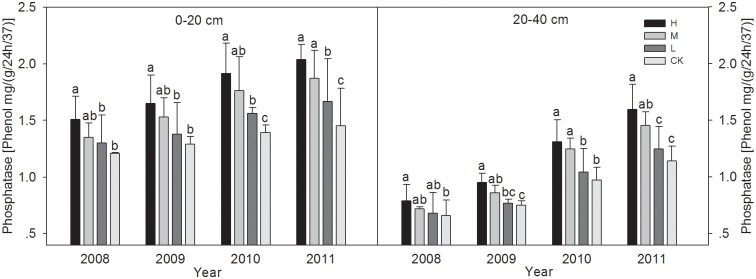
Fig 3. The changes of Phosphatase activities in 0–20 and 20–40 cm soil layers under different wheat straw incorporation treatments.

Note: CK, no straw incorporation; L, incorporation of straw at a low rate of 3 000 kg hm-2 wheat straw; M, incorporation of straw at a medium rate of 6 000 kg hm-2 wheat straw; H, incorporation of straw at a high rate of 9 000 kg hm-2 wheat straw. Bars with different lowercase letters indicate significant differences (P<0.05).
