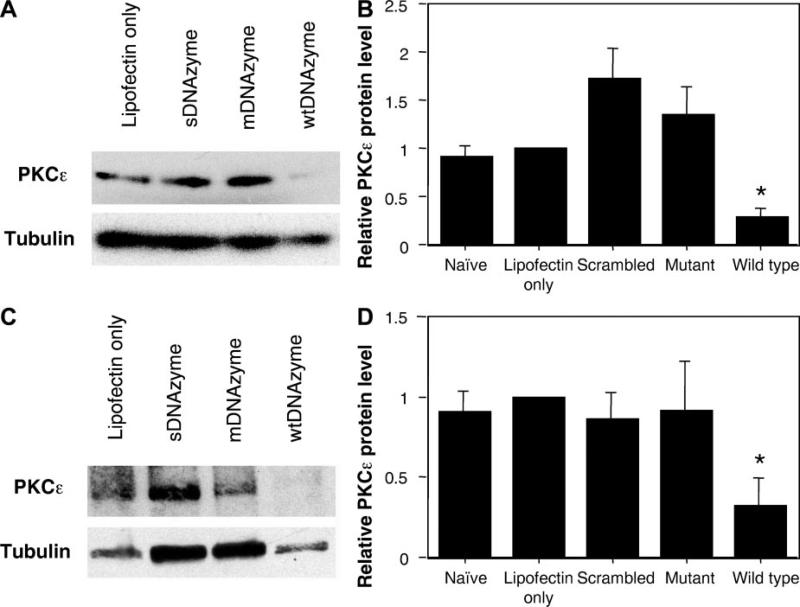
Fig. 3.
Effects of DNAzymes on PKC-ε protein levels in cultured cells. A: Western blots of hPASMCs. Representative Western blots for PKC-ε (top) or β-tubulin (bottom) from hPASMCs treated with liposome alone, wtDNAzyme, mDNAzyme, or sDNAzyme are shown. B: quantification of protein levels in hPASMCs. Western blots from 5 separate transfection experiments using hPASMCs were digitized, analyzed by densitometry using NIH Image, and normalized to liposome only treatment. Values are expressed as normalized averages ± SE. A Mann-Whitney U-test gave a P value of 0.016 for the wtDNAzyme-induced PKC-ε decrease compared with the other conditions. C: Western blots of A7r5 cells. Representative Western blots for PKC-ε (top) or β-tubulin (bottom) from rat A7r5 cells treated with liposome alone, wtDNAzyme, mDNAzyme, or sDNAzyme are shown. D: quantification of protein levels in A7r5 cells. Western blots from 3 separate transfection experiments using A7r5 cells were digitized, analyzed by densitometry using NIH Image, and normalized to liposome only treatment, as described in B. *P = 0.003 for PKC-ε levels in wtDNAzyme-treated cells vs. all other conditions by Mann-Whitney U-test.

