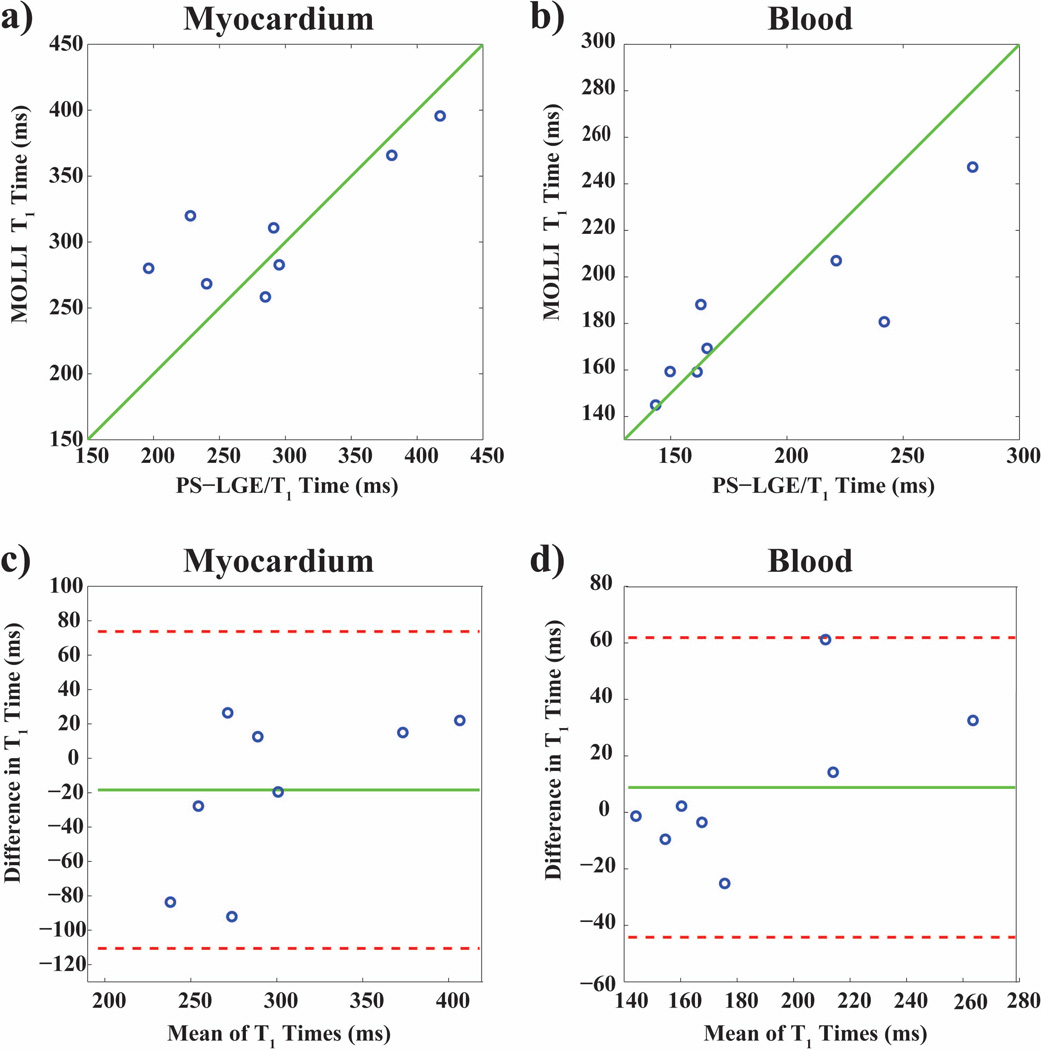
Figure 5.
In vivo T1 times assessed in the left ventricular (LV) myocardium (left) and the LV and right ventricular (RV) blood pools (right) in eight healthy subjects with the proposed PS-LGE/T1 sequence and 2D MOLLI. The identity line is indicated in green. The sequences were performed in randomized order. The correlation coefficients were r = 0.80 (p = 0.019) for the myocardium, and r = 0.87 (p = 0.005) for the blood. Bland-Altman analysis shows no systematic variations, although more pronounced differences are observed for lower T1 values.

