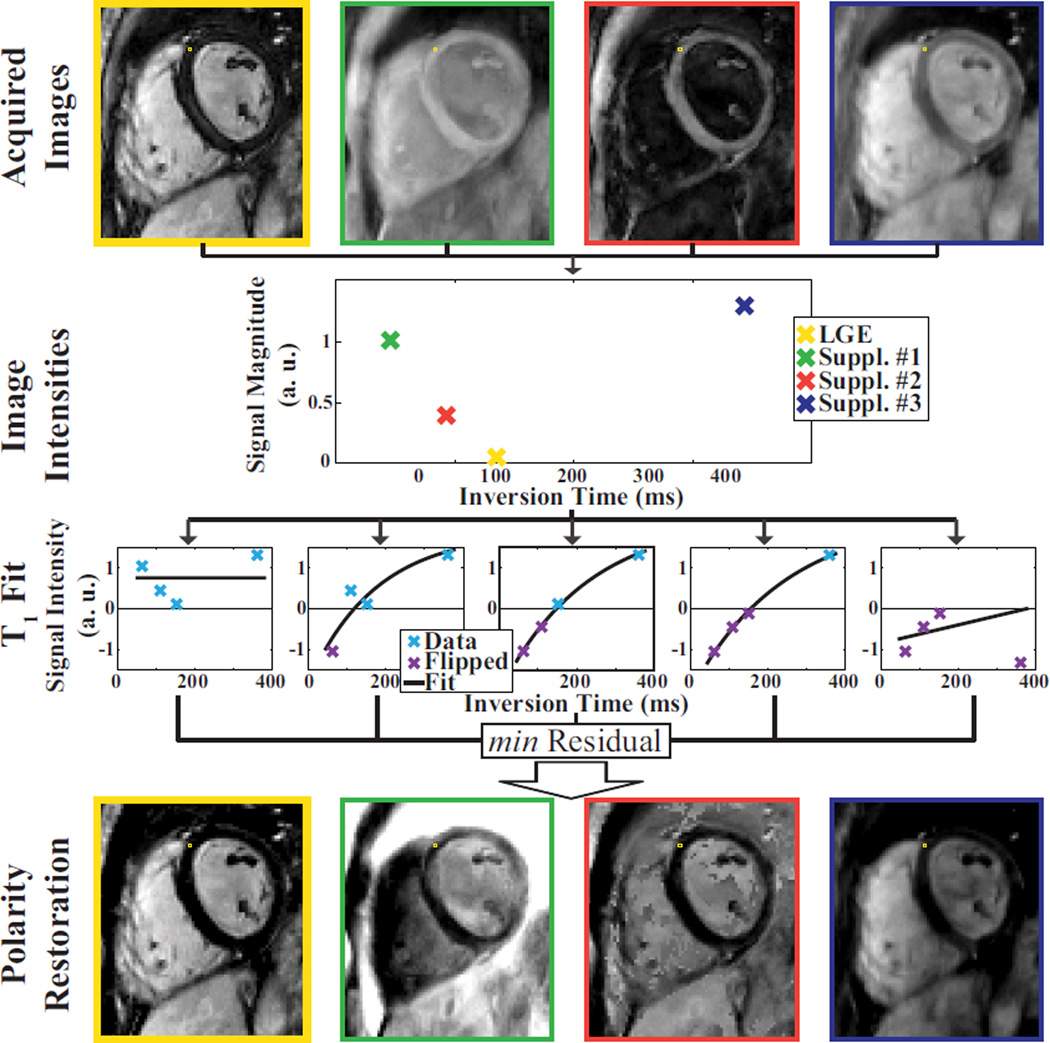
Figure 6.
Scheme for polarity restoration within the T1 fit process. The upper-most row shows the four acquired imaging volumes after reconstruction. The T1 fit and the polarity restoration is performed voxel-wise, and illustrated for a sample voxel in this image. The second row shows the intensity magnitude of this voxel in the imaging volume sorted by the inversion time. To restore the signal polarity of the image magnitude the curve-fit to the recovery model is repeated five times, as shown in the third row. The first fit is performed on data where all intensities are assumed to have a positive sign. The second fit is performed under the assumption that only the data point with the shortest inversion time has a negative sign, and so on. The fitted curve that results in the least residual fit error was assumed to work on the image intensities with corrected polarity. Subsequently, the sign as determined in this multi-fit approach is voxel-wise multiplied with the original intensity magnitude to obtain a polarity-restored LGE imaging volume. The four imaging volumes after polarity restoration are shown in the bottom row. The LGE image after polarity restoration is highlighted by a yellow frame.

