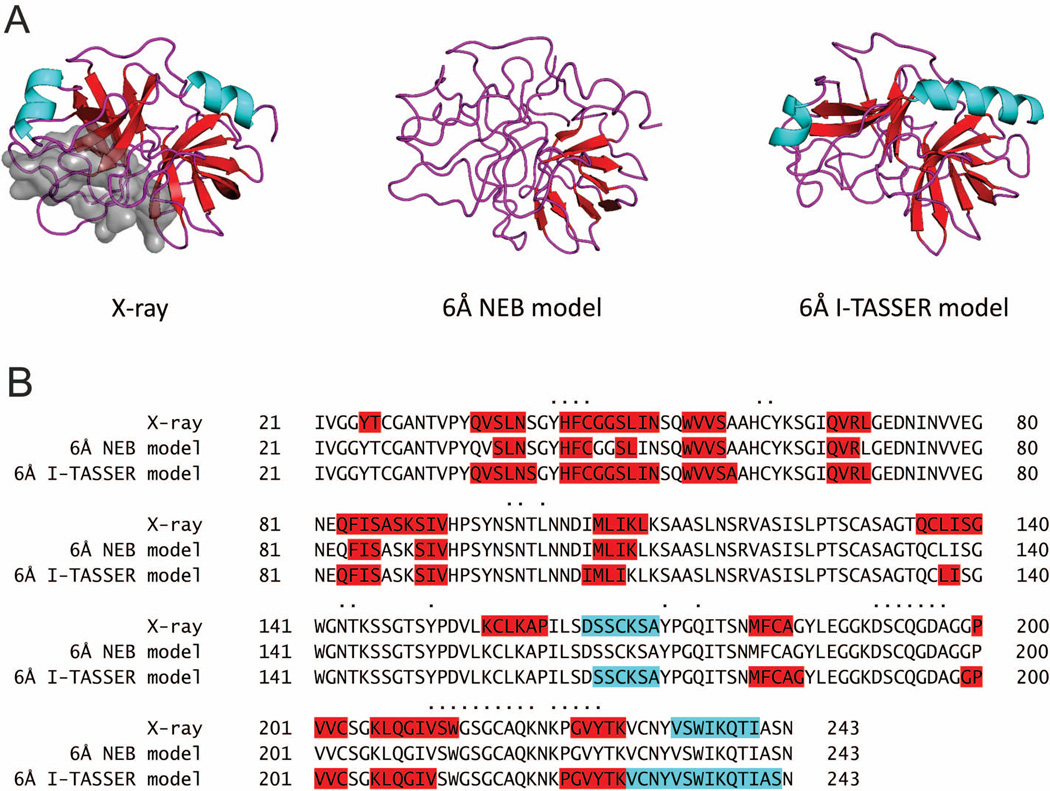
Figure 3.
Comparison of X-ray, NEB and I-TASSER structures. Secondary structure content for the PDB entry 1oph, chain B; α-helices and β-strands are in cyan and red, respectively. The interface is shown by gray surface (A) and dots (B). The secondary structure is substantially distorted in the NEB model, whereas well preserved and close to the X-ray structure in the I-TASSER model.

