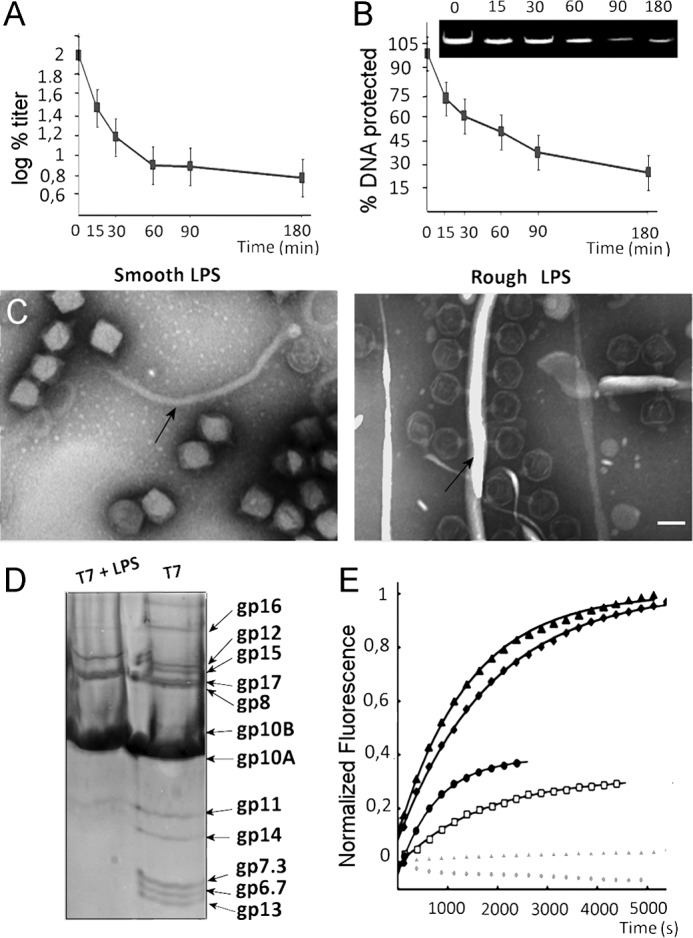
FIGURE 1.

Rough LPS triggers T7 phage genome ejection in vitro. A, T7 particles (1011 pfu/ml) were incubated with ∼250 μg/ml rough LPS at 37 °C for the indicated times and plated. The log of the percentage of titer is plotted. Error bars indicate mean ± S.D. B, deprotection of genomic DNA from DNase digestion after incubation of T7 particles with rough LPS. The inset shows the ethidium bromide-stained 0.8% agarose gel from which the densitometric analysis shown in the graph was obtained. Error bars indicate mean ± S.D. C, electron micrographs showing negatively stained particles incubated with smooth LPS (left) or rough LPS (right). Arrows indicate the LPS layers. Bar = 50 nm. D, denaturing gel electrophoresis of T7 phages before (right) and after (left) incubation with rough LPS. E, DNA ejection of T7 phages (∼5 × 10⁹ pfu) monitored by fluorescence at 37 °C in the presence of Yo-Yo fluorescent dye. DNA release was triggered by the addition of rough LPS: 10 μg/ml (open black squares), 20 μg/ml (closed black circles), 50 μg/ml (closed black squares), and 100 μg/ml (closed black triangles). Lines show overall fit of the data to the equation corresponding to two first order reactions (25). The control experiment was performed without LPS (closed gray triangles) or with smooth LPS (closed gray circles). For clarity, only 1 out of 20 data points has been represented.
