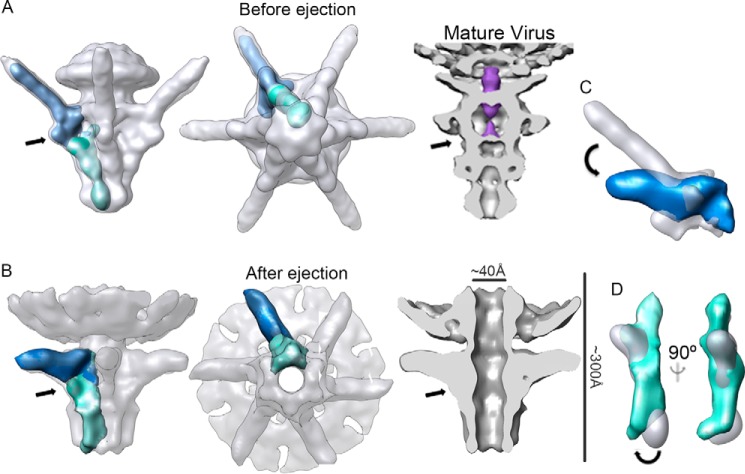
FIGURE 4.
Conformational changes in the tail complex after DNA ejection. A, three-dimensional reconstruction of the T7 tail before DNA ejection (EMD-5689) (13) in a side view (left) and an end-on view (middle). Right, a section view of the tail segmented from the mature virus (EMD-1163) (32); DNA inside the channel is shown in purple. B, three-dimensional reconstruction of the T7 tail after DNA ejection in side (left), end-on (middle), and section views (right). Arrows indicate the interaction between the fiber and the gatekeeper and the position where the DNA appears to be halted. The length of the complex and the dimension of the channel diameter are indicated. A single subunit of the gp12 protein (nozzle) and a trimer of N-terminal gp17 fiber domain are shown in green and dark blue, respectively. C, overlap of the gp17 trimer before (white) and after (blue) DNA ejection. An arrow shows predicted movement of the fiber. D, overlap of a gp12 monomer before (white) and after (green) DNA ejection; two views of the same segmented electron density are shown. An arrow indicates the predicted movement of the nozzle.

