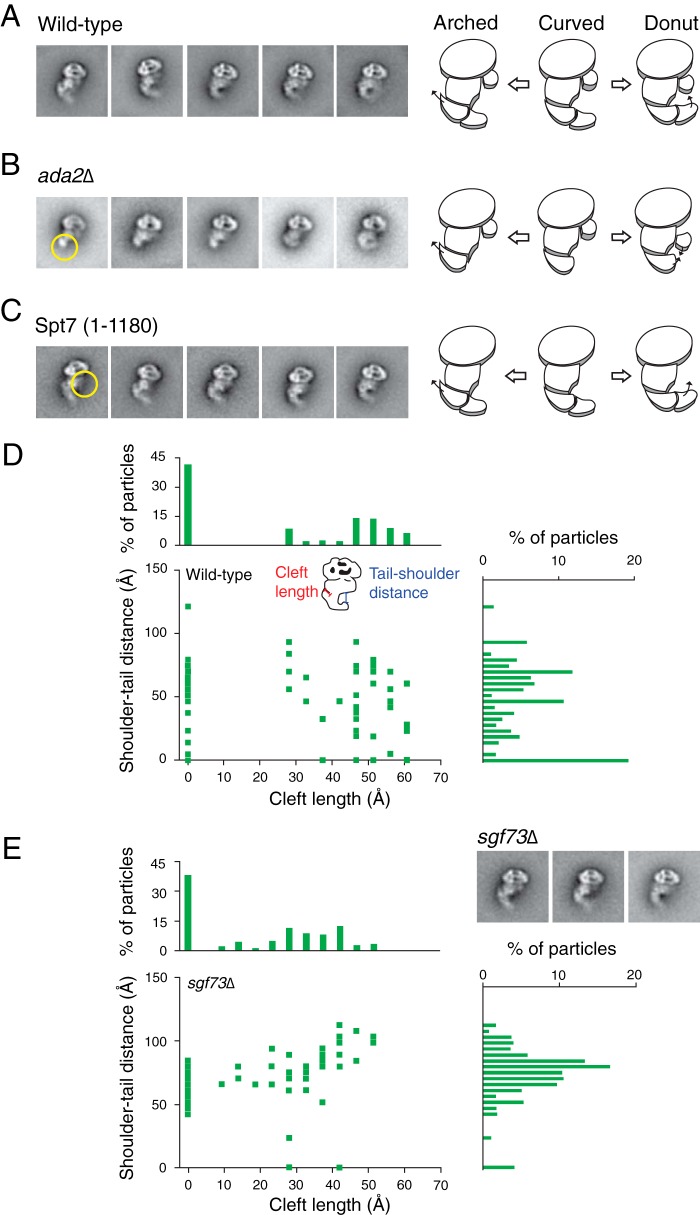
FIGURE 2.
Effects of mutations on SAGA flexibility. SAGA containing subunit deletions were analyzed using single-particle EM for loss of density and changes in flexibility. A–C, class averages from wild type, ada2Δ, and truncated Spt7(1–1080) SAGA arranged to display their range of flexibility. Yellow circles show electron densities that are absent from the mutants compared with wild type. Schematics of SAGA demonstrates the movement of regions and missing densities within the complex. D and E, conformational population analysis of wild type and Δsgf73 SAGA. Description of the measurements used are shown in D. The bar graphs represent the total number of particles measured for each value on the corresponding axis.

