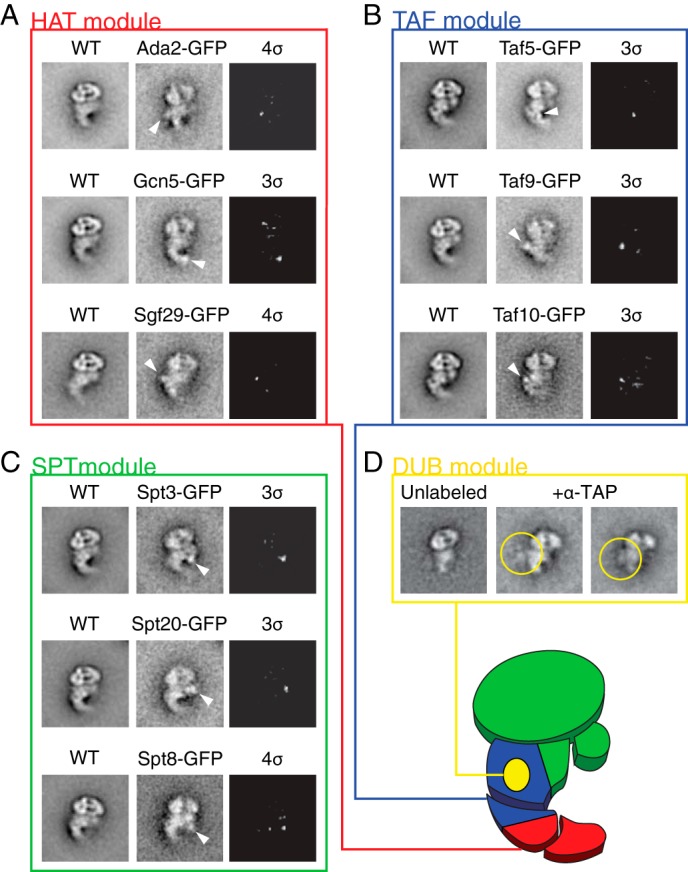
FIGURE 4.

Localization of SAGA domains and subunits. A–C, class averages of untagged WT SAGA and SAGA containing GFP-tagged subunits were compared to determine the approximate locations of the tagged subunits. White arrows denote the additional density on the GFP-tagged image. The third images of each set are difference maps between tagged and untagged SAGA, thresholded to show only signals 3 or 4 standard deviations (σ) above the average pixel value. D, to localize the DUB module, SAGA purified using Sgf73-TAP subunit was incubated with α-TAP antibody and visualized using single-particle EM. Yellow circles denote density attributed to the antibody. The proposed locations of the modules are shown on the schematic of SAGA in the lower right corner of the figure.
