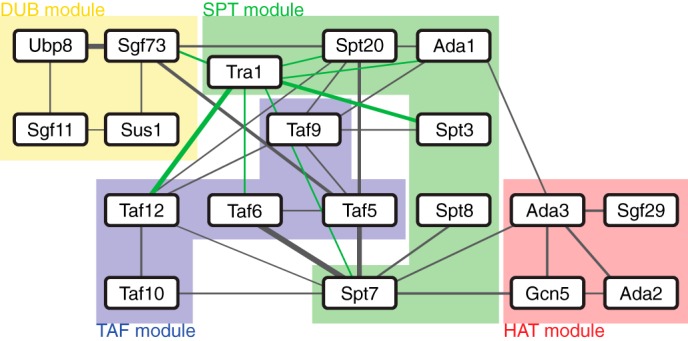
FIGURE 5.

Network of SAGA subunit interconnectivity determined using cross-linking mass spectrometry. Lines denote cross-links, and the line thickness is proportional to the number of cross-link spectra detected between two subunits. Cross-links involving Tra1 are shown in green for clarity. Subunits are grouped into their respective domains, as shown by the labeled highlights.
