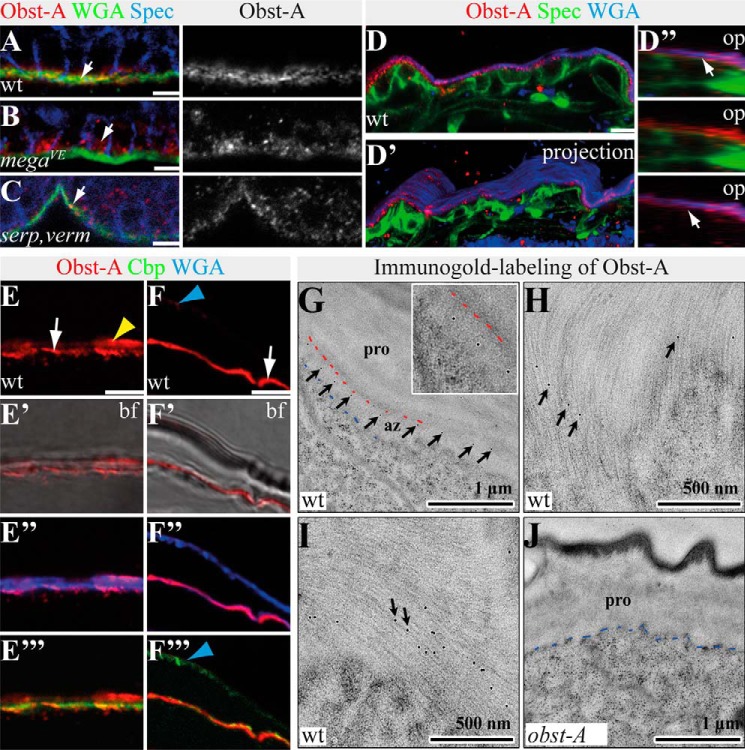
FIGURE 3.
Epidermal Obst-A is localized within the cuticle. A–C, confocal images show epidermal cells of stage 17 embryos labeled with anti-Obst-A (red), the membrane marker anti-α-Spectrin (blue), and WGA (green) marking the apical cell surface (green). The single Obst-A channel is presented in gray. Scale bars indicate 5 μm. A, in stage 17 wild type embryos, Obst-A is enriched (arrow) at the apical cell surface, which is marked by WGA. Only weak intracellular Obst-A distribution is found within epidermal cells. Spec marks plasma membranes of epidermal cells. B, in stage 17 mega mutant embryos, Obst-A remains in epidermal cells (arrow), and extracellular Obst-A staining was reduced. C, in stage 17 serp,verm mutants, Obst-A was normally enriched at the apical cell surface (arrow). D–D″, confocal analysis of whole mount staining of a wild type first instar larva labeled with anti-Obst-A (red), WGA (blue), and anti-α-Spectrin (green). Confocal scan (D), three-dimensional (D′), and orthogonal projections in D″ of the epidermis demonstrate extracellular Obst-A overlap (arrows) with the apical cell surface marker WGA (D″, bottom panel) but not with α-Spectrin (D″, middle panel). E and F, confocal images of larval cross-sections, labeled with Obst-A (red), Cbp (chitin, green), and WGA (blue) and bright field microscopy. E–F″′, in mid (E–E″′) and late (F–F″′) first instar larval epidermis, both newly deposited cuticle and old first instar cuticle are detected (14). Obst-A is localized at the apical cell surface together with newly deposited chitin (arrows) and at outer regions (yellow and blue arrowheads), probably representing the old first instar cuticle. Obst-A staining overlaps with WGA (E″ and F″) and chitin (Cbp, E″′, F″′). Analysis of first and second instar larvae (n ≥ 20) is shown. Scale bars, 5 μm. G–J, immunogold labeling of Obst-A in second instar wild type (G–I) and obst-A mutant epidermis (J). G, in second instar wild type larval epidermis, immunogold labeling of Obst-A (arrows) is enriched at the apical cell surface but underneath the procuticle. The inset shows a high magnification. Blue dashes indicate the apical cell surface, and red dashes the start of the procuticle. Apical cell surface is at the bottom in all images. Scale bars represent 1 μm. H and I, single or even several immunogold particles labeling Obst-A (arrows) overlap with chitin fibrils within the assembly zone. Scale bars represent 500 nm. J, in obst-A null mutant larvae, no immunogold particles were observed at the chitin matrix. Blue dashes indicate the apical cell surface. pro, procuticle; az, assembly zone; bf, bright field; op, orthogonal projections. Scale bars, 1 μm.

