FIGURE 4.
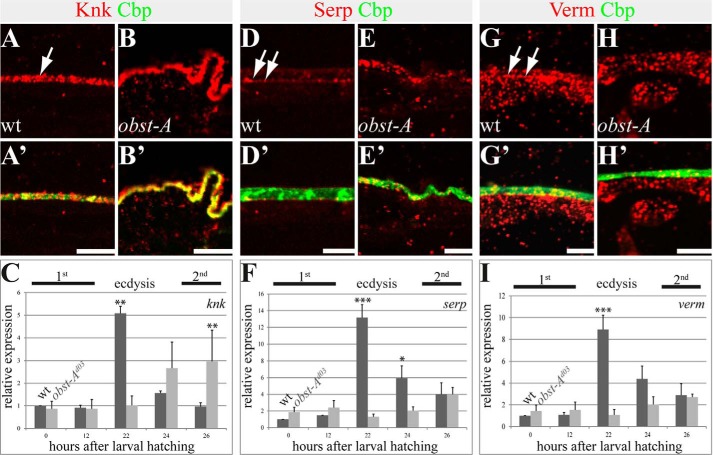
Epidermal localization and expression of the chitin protector Knk and the chitin deacetylases Serp and Verm. The top and middle panels show confocal images of first instar larval cross-sections and labeled with anti-Knk (red), anti-Serp (red), anti-Verm (red), and Cbp (chitin, green). The bottom panel provides qRT-PCR analysis of relative knk (C), serp (F), and verm (I) expression in wild type and obst-A null mutant larvae. A–B′, Knk localization in wild type (A and A′) and obst-A mutant (B and B′) epidermis. In late first instar larval epidermis, Knk is distributed in the chitin matrix (arrow in A) where it co-localizes with the chitin marker Cbp (A and A′). In late first instar obst-A mutant epidermis, Knk staining appeared slightly enriched but revealed a wild type-like distribution (B and B′). D–E′, in wild type mid first instar epidermis, Serp staining is enriched at the apical cell surface (arrows in D). Serp staining is not distributed throughout the entire chitin matrix, because it only partially overlaps with chitin as detected by Cbp (D′). In first instar obst-A mutant epidermis, Serp staining is mislocalized and is found throughout the chitin matrix without enrichment at the apical cell surface (E and E′). G–H′, Verm localization in wild type (G and G′) and obst-A mutant (H and H′) epidermis. Verm staining resembles the Serp pattern. Verm is enriched in the newly deposited chitin matrix (arrows in G) where it partially overlaps with chitin (G′). In first instar obst-A mutant epidermis, Verm is mislocalized within the chitin matrix. Analysis of wild type and obst-A mutant larvae (n ≥ 20) is shown. Scale bars represent 5 μm. C, F, and I, qRT-PCR analysis of relative expression in wild type and obst-A null mutant larvae shows a significant up-regulation of knk, serp, and verm levels 22 h after larval hatching, which corresponds to ecdysis from first to second instar larval stage. In obst-A mutants, however, knk, serp, and verm expression is not up-regulated at 22 h after larval hatching. knk levels are significantly enriched at 26 h after larval hatching, shortly before obst-A mutants start to die. Significance (one-way analysis of variance) is compared with values 0 h after hatching of wild type larvae and indicated by asterisks, and standard error of the mean is represented by bars. p values are represented by asterisks: *, p < 0.05; **, p < 0.01; and ***, p < 0.001.

