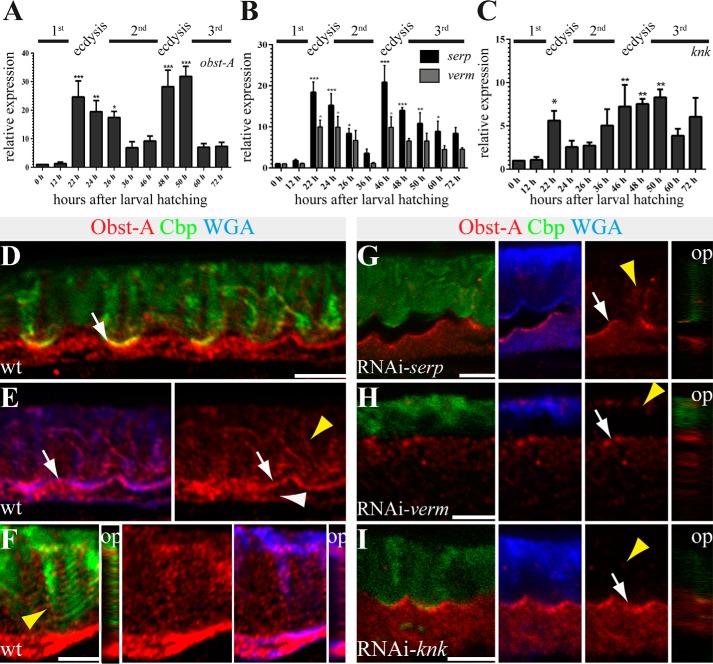
FIGURE 6.
Knk, Serp, and Verm are involved in larval Obst-A expression and its localization within the cuticle. A–C, qRT-PCR analysis shows relative expression levels of obst-A (A), serp and verm (B), and knk (C) throughout larval development. obst-A, serp, verm, and knk expression levels are up-regulated during ecdysis to second and third instar stages. Significance (one-way analysis of variance) is compared with values 0 h after larval hatching and indicated by asterisks, and S.E. is represented by bars. p values are represented by asterisks: *, p < 0.05; **, p < 0.01; and ***, p < 0.001. D–I, confocal images of third instar larval cross-sections, labeled with Obst-A (red), Cbp (chitin, green), and WGA (blue). Orthogonal projections of Z-stacks are depicted in small images. D and E, in wild type third instar larvae, chitin (Cbp, green) and the apical cell surface marker WGA (blue) co-localize with Obst-A (red) staining at the epidermal apical cell surface (white arrows). Obst-A (red) alone is depicted at the right side. Obst-A is enriched at the apical cell surface, and in addition lower levels were detected intracellularly (white arrowhead) and in the chitin-rich procuticle (yellow arrowhead). F, the third instar procuticle consists of several distinct chitin lamellae, as indicated by the stratified chitin staining. Obst-A co-localizes with the lamella-like chitin (arrowhead, left image) and with WGA (blue) detected in the chitin matrix. Orthogonal projections are presented in small images, and Obst-A is alone in the central image. G–I, serp, verm, and knk knockdown larvae (n ≥ 18) show defective chitin matrix organization and extracellular Obst-A staining appeared reduced (yellow arrowheads), but Obst-A enrichment at the apical cell surface is detected in serp and knk and partially in verm knockdown (arrows). The cuticle is detached in serp, but not in knk or verm knockdown larvae. op, orthogonal projections. Scale bars represent 5 μm.

