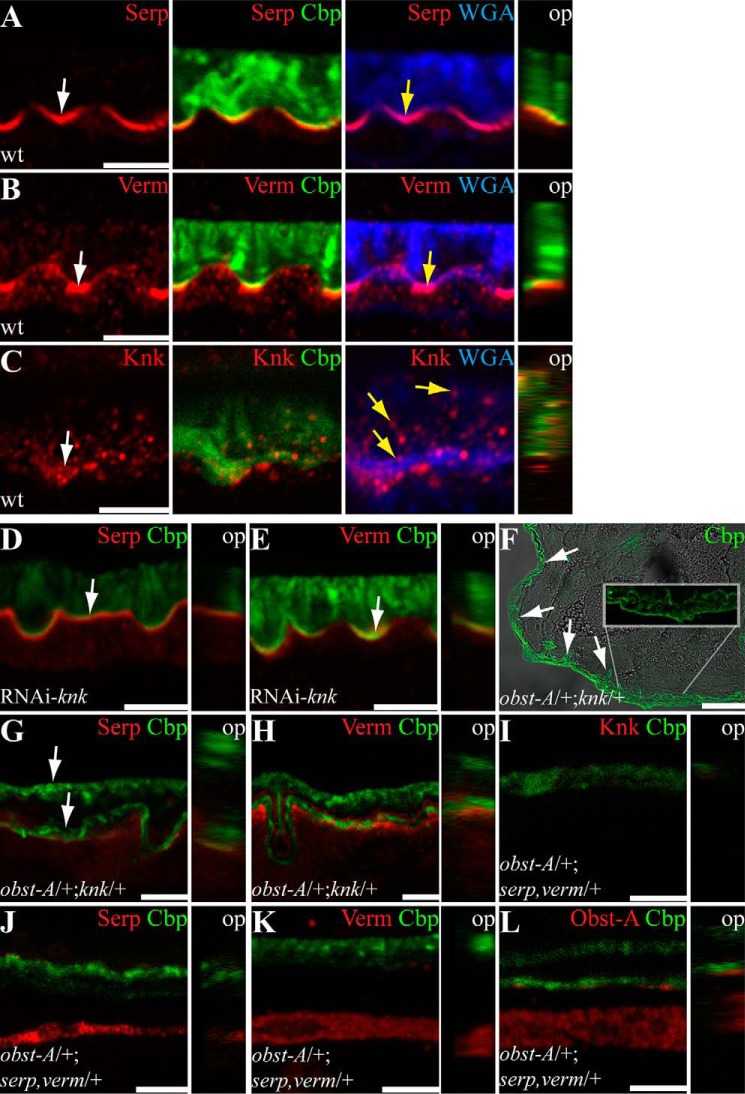
FIGURE 7.
Genetic control of epidermal cuticle organization in Drosophila larvae. Confocal images of third instar larval cross-sections, labeled with Serp (red in A, D, and G), Verm (red in B, E, and H), Knk (red; C and I), and Obst-A (red; F). Chitin is detected by Cbp (green) and the apical cell surface by WGA (blue). Orthogonal projections of Z-stacks are depicted in small images. A and B, Serp and Verm are strongly enriched at the apical cell surface (white arrows) overlapping with chitin (Cbp, green) and WGA (yellow arrows). Orthogonal projections confirm enrichment at the apical cell surface overlapping with the chitin matrix. C, Knk signal is enriched (white arrow) but not restricted to the apical cell surface. Knk is distributed throughout the whole chitinous procuticle (yellow arrows). The orthogonal projection visualizes the distribution of Knk within the whole procuticle. D and E, the RNAi-mediated knockdown of knk shows reduced extracellular Serp (D) and Verm (E) staining, which, however, appeared still enriched at the apical cell surface (arrows). F–H, in transheterozygous obst-A/+;knk/+ third instar larvae (n = 6), chitin matrix is deformed, cuticle molting is defective (arrows in F and G), and extracellular Serp (G) and Verm (H) stainings are decreased. Approximately 50% of such mutant larvae frequently show obst-A mutant-like wrinkled epidermal cuticle (arrows in F) but not detached cuticle. The inset highlights the wrinkled newly synthesized cuticle and the outer old cuticle. I–L, in transheterozygous obst-A/+;serp,verm/+ third instar larvae (n = 14), chitin matrix organization is defective, and the cuticle is frequently detached from the epidermis. These mutants show reduced extracellular Knk (red; I), Serp (red; J), Verm (red; K), and Obst-A (red; L) stainings. Transheterozygous mutants show strong reduction or loss of Obst-A, Serp, and Verm accumulation at the apical cell surface. The transheterozygous obst-A/+;serp,verm/+ mutants show detached (6 of 14) but not wrinkled cuticle. op, orthogonal projections. Scale bars represent 5 and 50 μm in F, respectively.

