
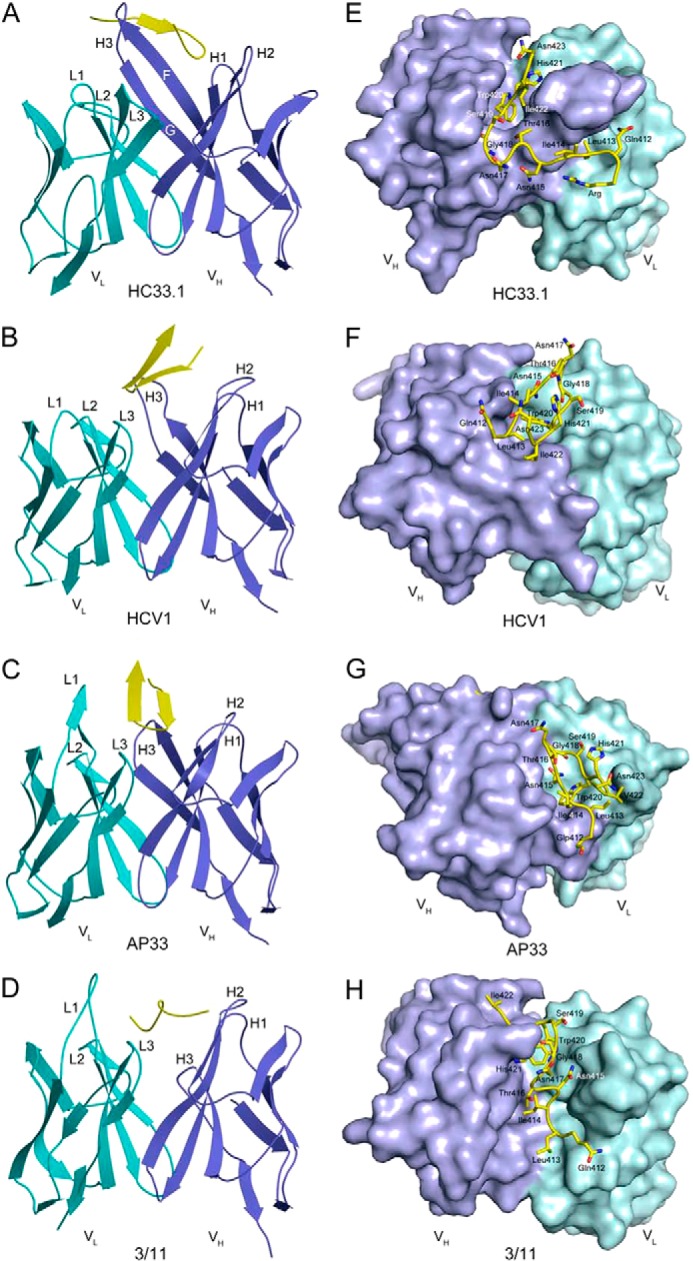
FIGURE 1.
Structure of the HC33.1-E2412–423 complex and comparison with other antibody-E2412–423 complexes. A, ribbon diagram of the HC33.1-E2412–423 complex (side view). Cyan, VL; blue, VH; yellow, E2412–423. VLCDR loops are labeled L1–L3; VHCDR loops are labeled H1–H3. β-Strands F and G of the VH domain are labeled. B, structure of the HCV1-E2412–423 complex (Protein Data Bank accession code 4DGY). The bound peptide adopts a β-hairpin conformation. C, structure of the AP33-E2412–423 complex (Protein Data Bank accession code 4GAJ). D, structure of the 3/11-E2412–423 complex (Protein Data Bank accession code 4WHT). The peptide adopts an extended conformation. E–H, top view of the HC33.1-E2412–423 complex (E) compared with the HCV1-E2412–423 (F), AP33-E2412–423 (G), and 3/11-E2412–423 (H) complexes. For each antibody, the VL molecular surface is cyan, and the VH molecular surface is blue. The E2412–423 peptide is drawn in stick format with carbons atoms in yellow, nitrogen atoms in blue, and oxygen atoms in red.