FIGURE 5.

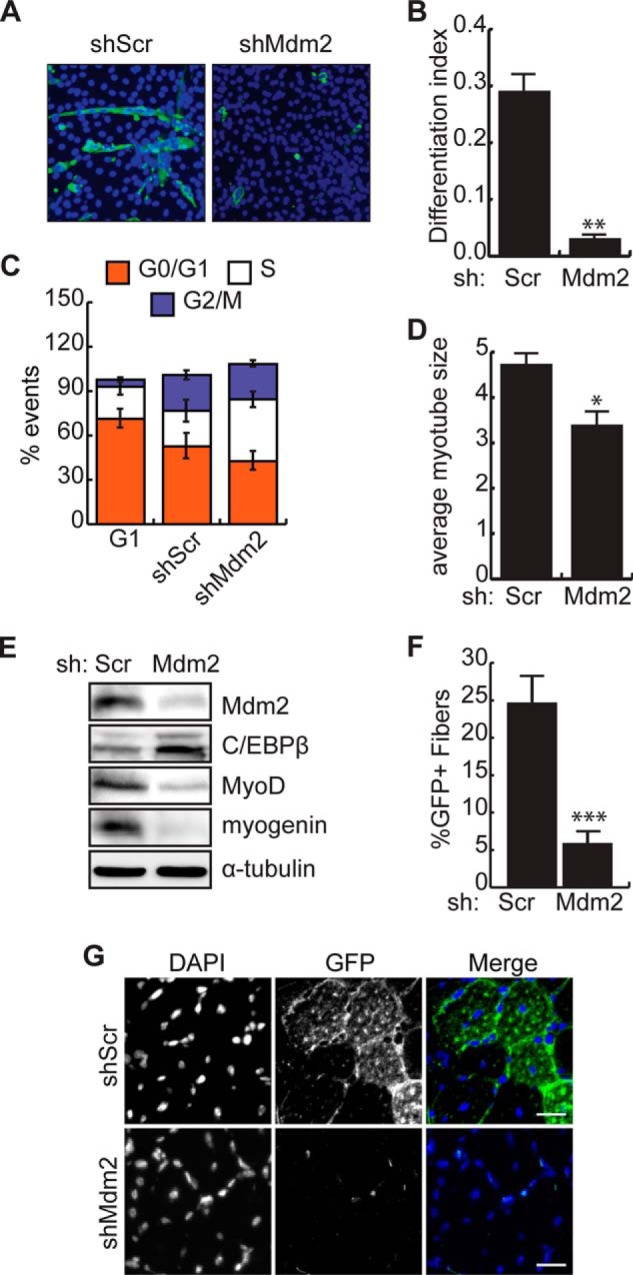
Loss of Mdm2 blocks myogenic differentiation and regeneration. A, immunocytochemistry for myosin heavy chain (MyHC) expression in C2C12 cells transduced to express shMdm2 or shScr and induced to differentiate for 7 days. DAPI stain reveals nuclei. B, differentiation index (no. nuclei in MyHC+ cells/total nuclei) for cells transduced and differentiated as in A. **, p < 0.01, n = 6. C, cell cycle analysis by flow cytometry in C2C12 cells forced into G1 arrest, or transduced as in A. Graph indicates the mean percentage of cells in each phase of the cell cycle ± S.D. The % cells in S-phase in shMdm2 cultures are significantly different (p = 0.044) from shScr controls. All other comparisons are not significantly different. D, average size of myotubes (no. nuclei in MyHC+ cells with nuclei>2/no. myotubes) for cells transduced and differentiated as in A. *, p < 0.05, n = 6. E, Mdm2, C/EBPβ, and myogenic marker protein expression in cells transduced and induced to differentiate as in A. F, percent of GFP+ fibers in regenerating muscle 2 weeks after injury with cardiotoxin and transplantation of primary myoblasts isolated from a GFP transgenic mouse transduced to express shMdm2 or shScr. ***, p < 0.001, n = 6. G, representative images of TA muscle from F. DAPI stains the nuclei. Scale bar, 25 μm.
