FIGURE 1.
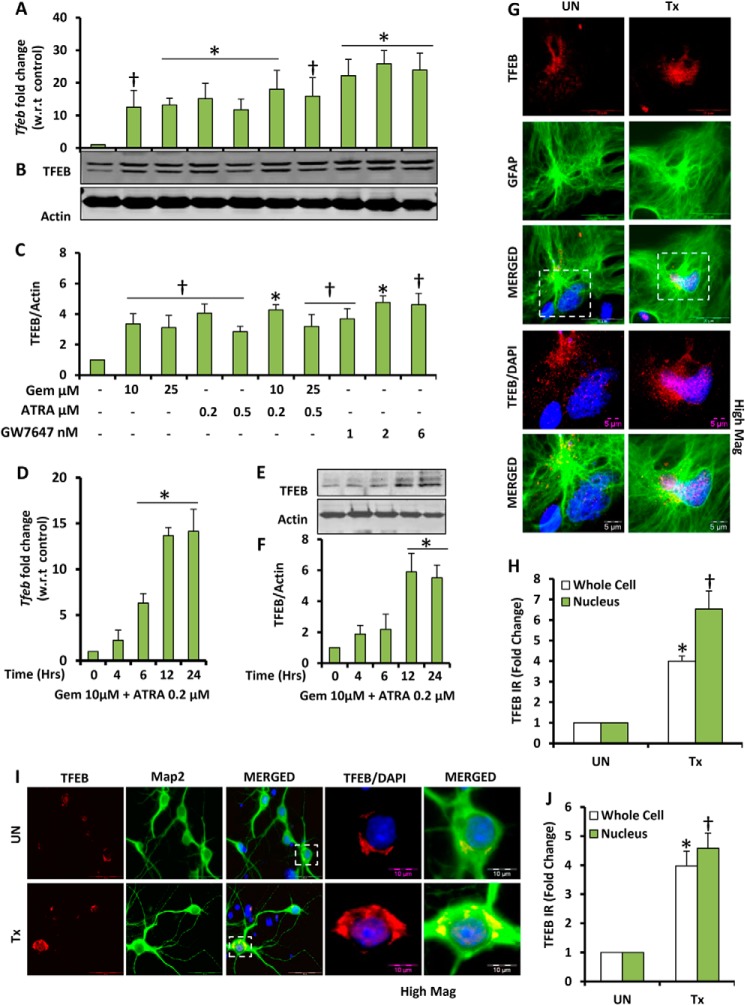
Gemfibrozil and retinoic acid up-regulate TFEB mRNA and protein levels in brain cells. A and B, mouse primary astrocytes were treated with different concentrations of gemfibrozil (Gem), ATRA, and GW7647 in serum-free DMEM/F-12 medium for 12 h followed by monitoring mRNA levels of Tfeb by qRT-PCR (A) and TFEB protein levels by immunoblot (B). C, densitometric analysis of the immunoblot for TFEB (relative to β-actin). D and E, mouse primary astrocytes were treated with a combination of gemfibrozil (10 μm) and ATRA (0.2 μm) for 4, 6, 12, and 24 h under similar culture conditions followed by monitoring of mRNA levels of TFEB by qRT-PCR (D) and protein levels by immunoblot (E). F, densitometric analysis for the immunoblot for TFEB. All results are representative of or the mean ± S.E. of at least three independent sets of experiments. †, <0.05 versus untreated control; *, p < 0.01 versus untreated control. G and I, mouse primary astrocytes (G) and mouse primary neurons (I) were treated with a combination of gemfibrozil and retinoic acid under serum-free conditions for 24 h and were double-labeled for TFEB (red)-GFAP (green) and TFEB (red)-Map2 (green), respectively. DAPI was used to stain nuclei. Scale bar, 20 μm (for G); scale bar, 5 μm for high magnification images (for G); scale bar, 50 μm (for I); scale bar, 10 μm for high magnification images (for I). H and J, quantification of TFEB immunoreactivity (TFEB IR) in whole cell and nucleus for mouse primary astrocytes (H) and mouse primary neurons (J) calculated as fold over control. At least 25 separate images per condition from three independent set of experiments are quantified using ImageJ. *, p < 0.05 versus untreated control (whole cell); †, p < 0.05 versus untreated control (nucleus). UN, DMSO-treated cells (used as control); Tx, treated with the combination of gemfibrozil (10 μm) and all-trans-retinoic acid (0.2 μm).

