FIGURE 2.
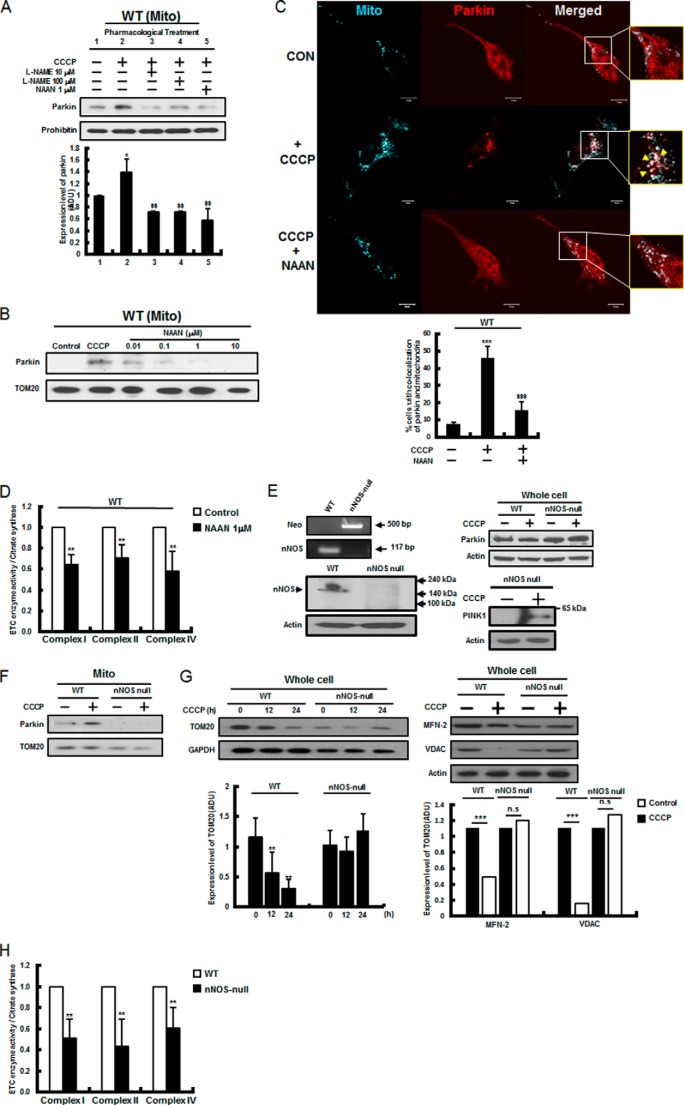
Parkin translocation was mediated by nNOS. A, wild-type cells were pretreated with either a pan-NOS inhibitor, Nω-nitro-l-arginine methyl ester (l-NAME, 10–100 μm) or an nNOS-specific inhibitor, NAAN (1 μm), for 12 h, and Parkin translocation by CCCP (10 μm for 2 h) was analyzed. Representative results are shown. The intensity of the Parkin band (normalized against that of prohibitin) was determined from three independent experiments by densitometry. ADU, arbitrary data unit. B, various concentrations of the nNOS-specific inhibitor NAAN (0.01∼10 μm) were treated, and Parkin translocation by CCCP was analyzed by immunoblotting. C, wild-type cells were transfected with mCherry-Parkin (red) and pMito-ECFP (cyan) and treated with CCCP in the absence and presence of NAAN (1 μm, pretreatment for 12 h). The mCherry-Parkin translocation was quantified by counting at least 100 cells under a confocal microscope as described under “Experimental Procedures.” Representative results are shown. Mito, mitochondria; CON, control. D, wild-type cells were pretreated with an nNOS-specific inhibitor, NAAN (1 μm), for 12 h, and ETC enzyme activities and complex I, II, and IV activities were measured as indicated and as described under “Experimental Procedures.” E, PCR reactions using genomic DNAs from primary MEF cells were performed with NOS1 and Neo primer sets (left panel, top), as indicated and as described under “Experimental Procedures.” Primary nNOS-null MEF cells were also analyzed by immunoblotting using anti-nNOS antibody (left panel, bottom). nNOS-null and wild-type MEF cell lysates were prepared as described under “Experimental Procedures,” and the expression levels of Parkin and PINK1 were analyzed by immunoblotting using anti-Parkin (right panel, top) and anti-PINK1 antibodies (right panel, bottom). F, after CCCP (10 μm for 3 h) treatment, nNOS-null and wild-type MEF cell lysates were prepared, and Parkin translocation was analyzed. G, after CCCP (10 μm) treatment, nNOS-null and wild-type MEF cell lysates were analyzed by immunoblotting using an antibody against TOM20, MFN-2, and VDAC. Representative results are shown. The intensities of the TOM20, MFN-2, and VDAC bands (normalized against that of either GAPDH or actin) were determined from three independent experiments by densitometry. H, ETC enzyme activities and complex I, II, and IV activities were measured in nNOS-null MEF cells as described under “Experimental Procedures.” All values are mean ± S.E. from at least three independent experiments. *, p < 0.05; ***, p < 0.005 (difference between control cells and treated cells). $$, p < 0.01; $$$, p < 0.005 (results of unpaired Student's t test for treatments). n.s., not significant.

