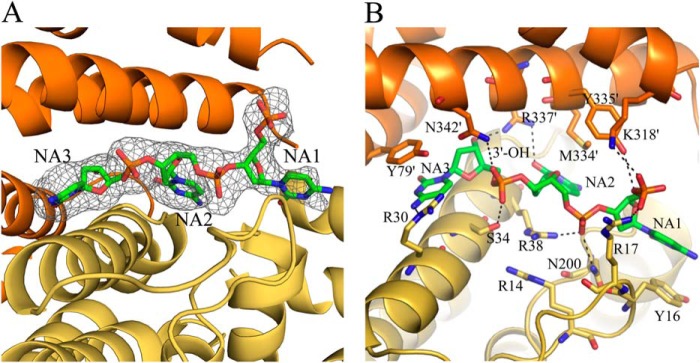
FIGURE 3.

Close-up views of the DNA-binding site of Dgt. A, simulated annealing Fo − Fc omit map of a DNA molecule bound at one of the two interfaces of monomers a (yellow) and b (orange). B, DNA-binding site showing potential hydrogen-bonding interactions. Hydrogen bonds (3.2 Å or less) are shown in dashed black lines. Additional ambiguous H-bond interactions are also shown, and measure 3.3–3.8 Å.
