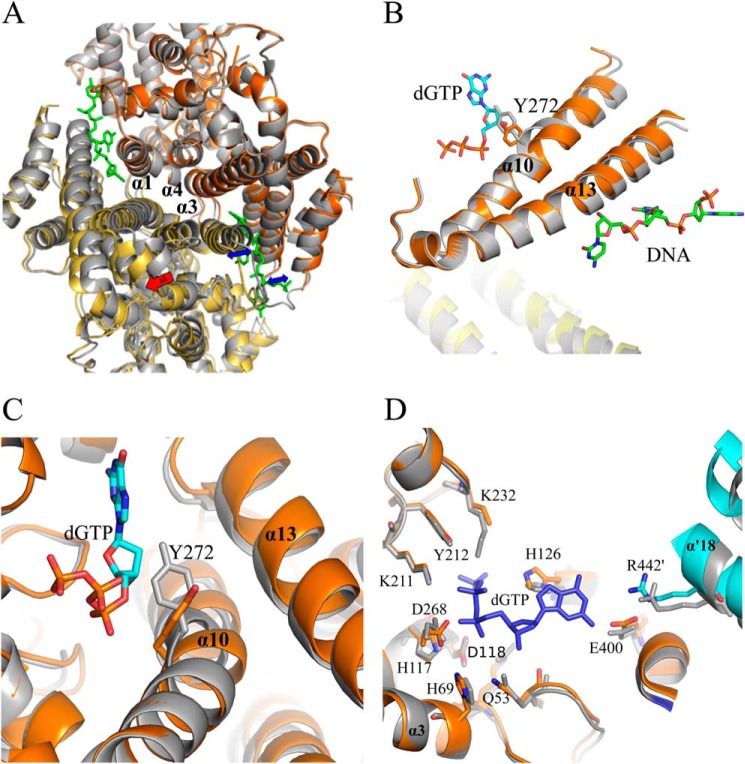
FIGURE 4.
Conformational changes within Dgt due to DNA binding. A, superposition of DNA-bound and non-DNA bound Dgt dimers. The DNA-bound dimer is represented in yellow and orange (chains a and b, respectively) and the unliganded dimer in gray (as in monomers c and d). Superposition is achieved by aligning the three central helices (α1, α3, α4) of monomer b with the corresponding helices of an unliganded monomer. The resulting shift is most clearly seen for the bottom monomer (yellow) as indicated by the red arrow (3 Å). The expansion of the two individual DNA-binding clefts is indicated by blue arrows. B, effect of DNA binding on helices α10 and α13, and the movement of residue Tyr-272 relative to the dGTP substrate. C, effects of DNA binding on the Dgt active site. Superposition was as shown in A with gray representing the unliganded state. The movement of the Tyr-272 side chain of helix 10 away from the dGTP substrate upon DNA binding is clearly seen. D, additional residue shifts in the Dgt active site upon DNA binding. Note the rotation of His-126 and shift in helix α′18 of the cyan-colored monomer (chain d), which intrudes into the active site. Also shown are the nearby His-69, His-117, Asp-118, and Asp-268 residues that define the HD family and coordinate metal binding for catalysis (9).

