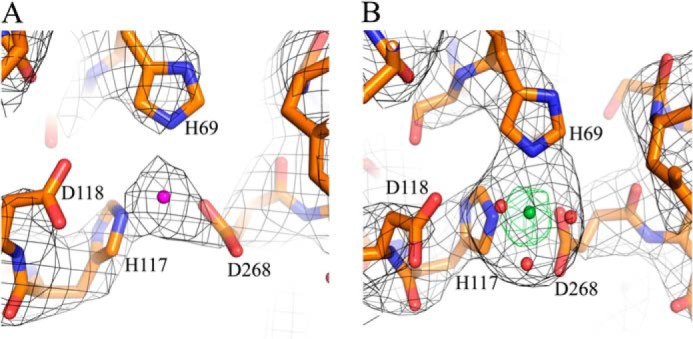
FIGURE 5.

Observed density at the Dgt metal-binding site. The density shown is at the metal-binding site defined by the His-69, His-117, Asp-118, and Asp-268 residues, as also shown in Fig. 4D. The density is most consistent with the presence of Mg2+ for structure 4X9E (purple, panel A) and Ni2+ for structure 4XDS (green, panel B). The small red spheres in panel B indicate water molecules.
