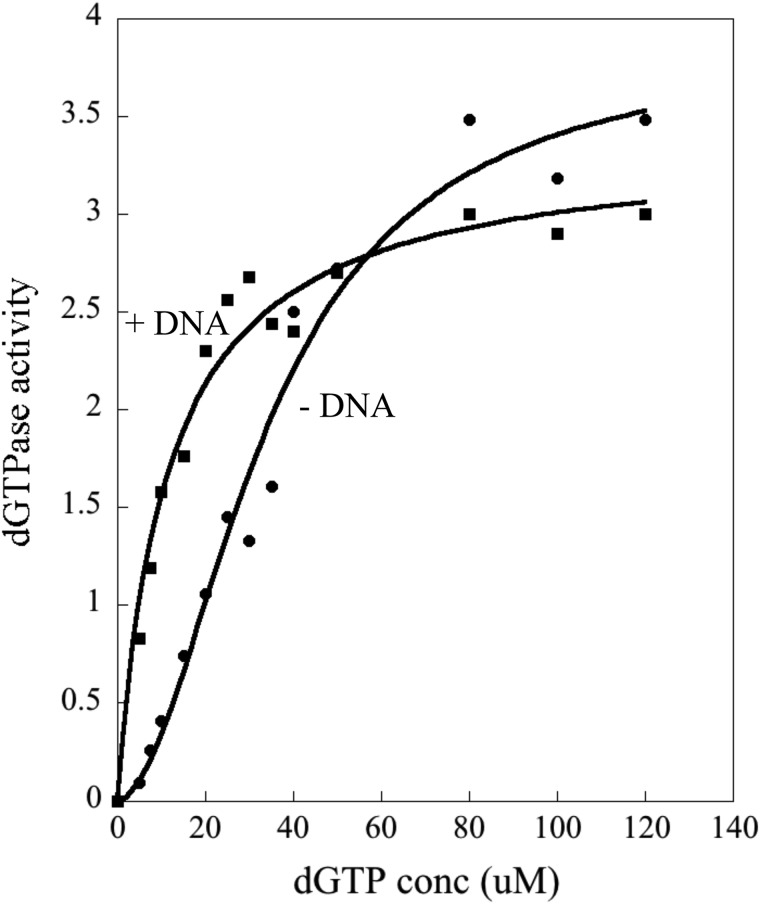
FIGURE 7.
dGTPase activity of Dgt in absence and presence of DNA. Dgt concentration was 4 nm, and the added DNA was a 40-mer oligomer (see “Experimental Procedures” for sequence) at 50 nm. The curve was fitted using the Hill equation. In the absence of DNA, the Km was calculated at 33 ± 1.5 μm and the Vmax at 4.2 ± 0.2 s−1. In the presence of DNA, the Km was 10 ± 1.5 μm and the Vmax 3 ± 0.3 s−1 (average of three repeated experiments).

