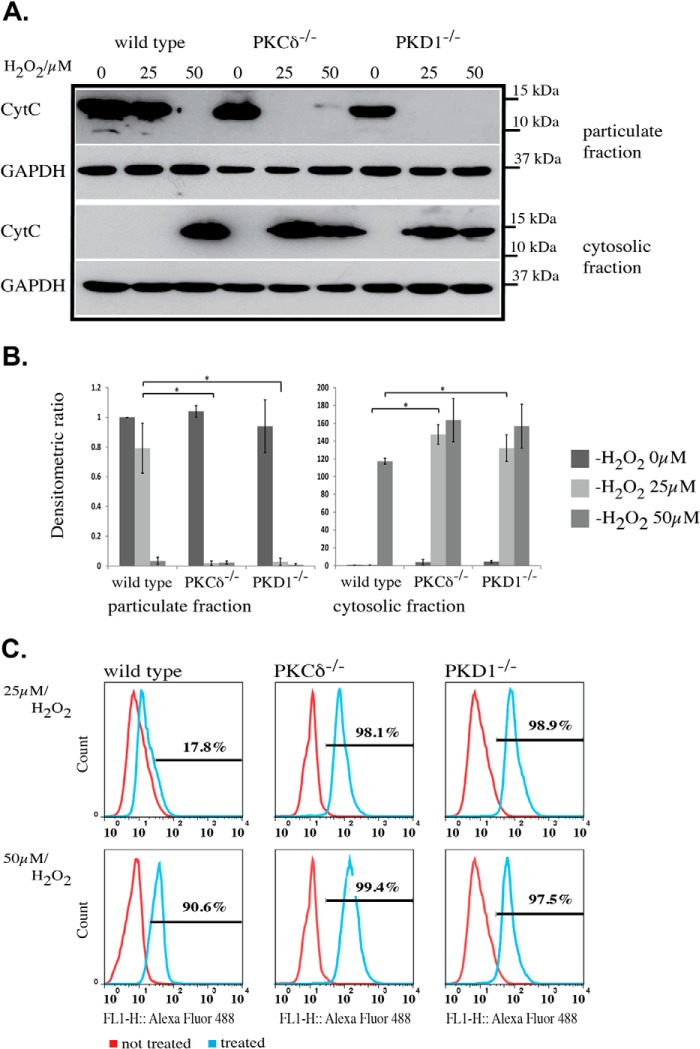
FIGURE 4.
Cytochrome c release and induced apoptosis in PKCδ−/− and PKD1−/− MEFs. A, Western blot analysis of Cyt c release after H2O2 treatment. The top represents the particulate fraction, and the bottom represents the corresponding cytosolic fraction. The genotypes of the MEFs and the H2O2 concentrations are indicated on the top of the graph. CytC, anti-cytochrome c antibody; GAPDH, anti-GAPDH antibody as loading control. B, densitometric quantification of A using ImageJ, with the particulate fraction on the left and the cytosolic fraction on the right. The results were normalized to the endogenous GAPDH protein levels. The error bars represent 1 ± S.D., and * indicates p values < 0.001 (particulate fraction) and < 0.003 (cytosolic fraction) by t test. C, histograms of TUNEL assays from different mouse embryonic fibroblast lines. The genotypes are indicated above, and the H2O2 concentrations (25 and 50 μm) are indicated on the left. Within the graph, the red line corresponds to untreated cells, whereas the blue line corresponds to treated cells. The percentage of apoptotic cells is indicated within the individual histograms. All of the results are typical of at least three independent experiments.

