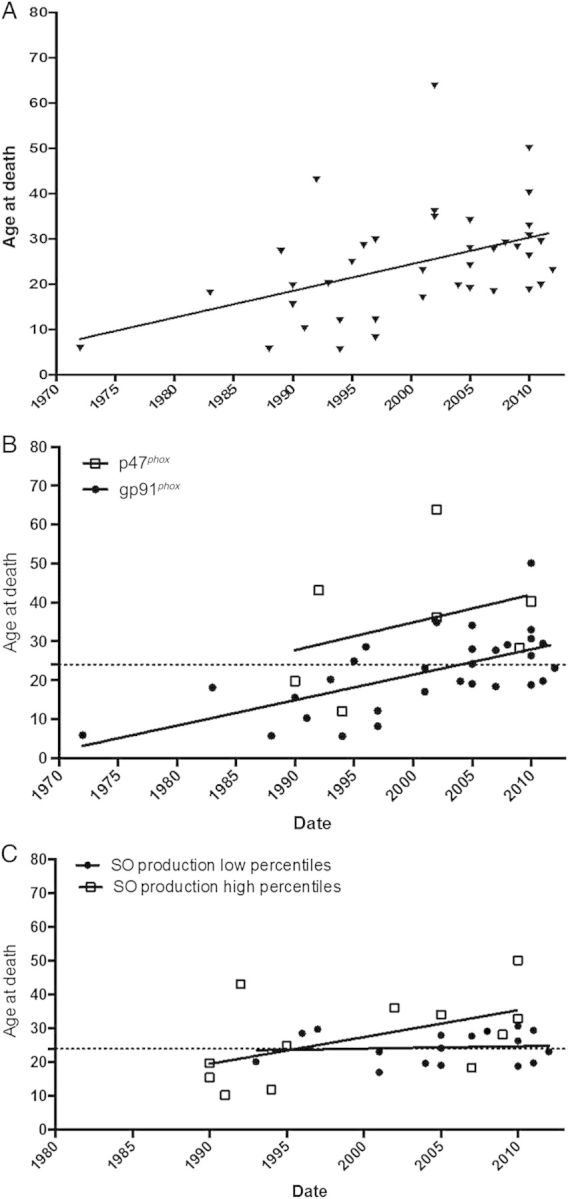
Figure 3.

CGD Deaths over the period 1970–2012. A, Ages at death for the entire cohort over time. B, Ages at death separated by p47phox (open squares) and gp91phox (closed circles). C, Ages at death separated by higher (open squares) and lower (closed circles) superoxide production. The Y axis is age at death, the X axis is years. The dotted line in figures B and C is average age at death (23 years) over the entire cohort over the entire period. The solid lines represent the fitted correlations. Abbreviations: CGD, chronic granulomatous disease; SO, superoxide.
