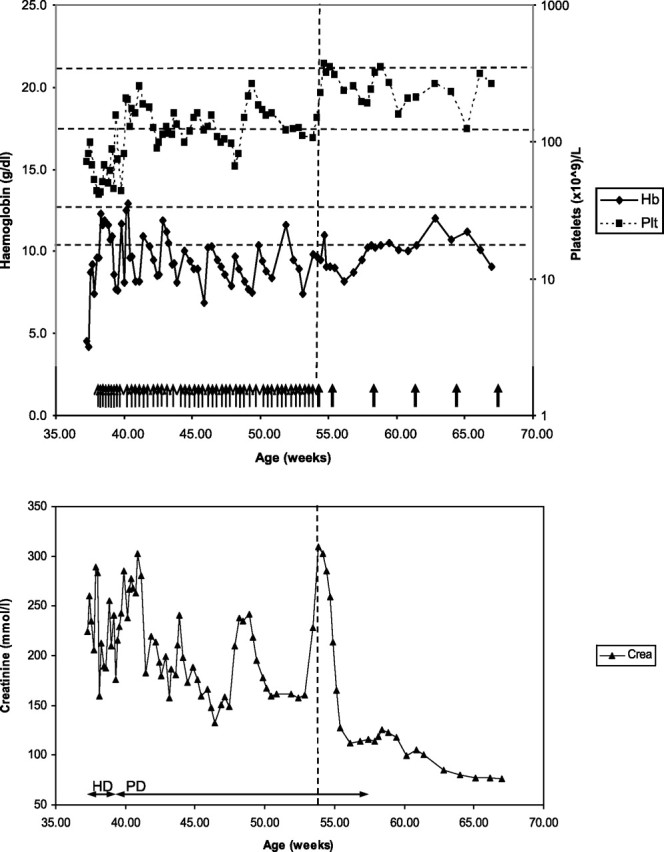
Fig. 1.

Clinical progress. Each thin arrow denotes a plasma exchange session (1 volume exchange with 5% albumin and 10 ml/kg virion inactivated plasma). Thick arrows denote eculizumab infusions. Vertical line represents the first eculizumab infusion. Horizontal dotted lines represent normal ranges for haemoglobin (bottom) and platelets (top) respectively. Time on haemodialysis (HD) and peritoneal dialysis (PD) represented by double arrowed lines.
