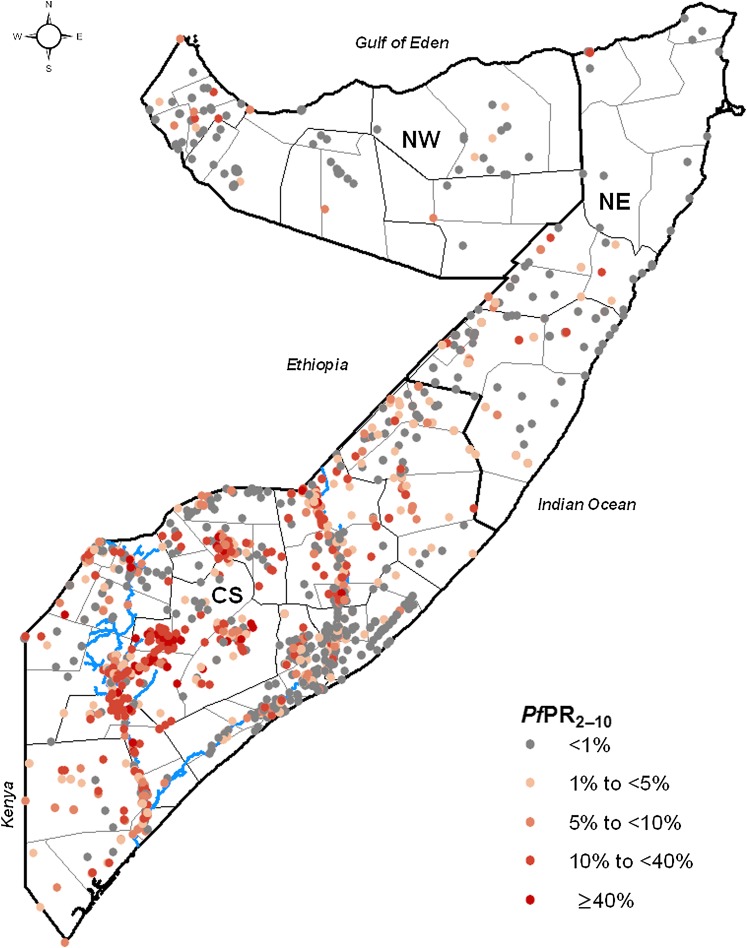
Figure 1.
Zone, regional and district maps of Somalia showing the distribution of the age-standardised community Plasmodium falciparum parasite rate (PfPR2–10) data (n=1558) assembled during the period 2007–2010 (including 54 surveys undertaken in 2011). The zones are CS, Central South; NE, North East; NW, North West. The thick black line show the zone boundaries, the thin black lines show the regional boundaries and the thin grey lines show the district boundaries. The blues lines show the location of the Juba (lower) and Shabelle (upper) Rivers.

