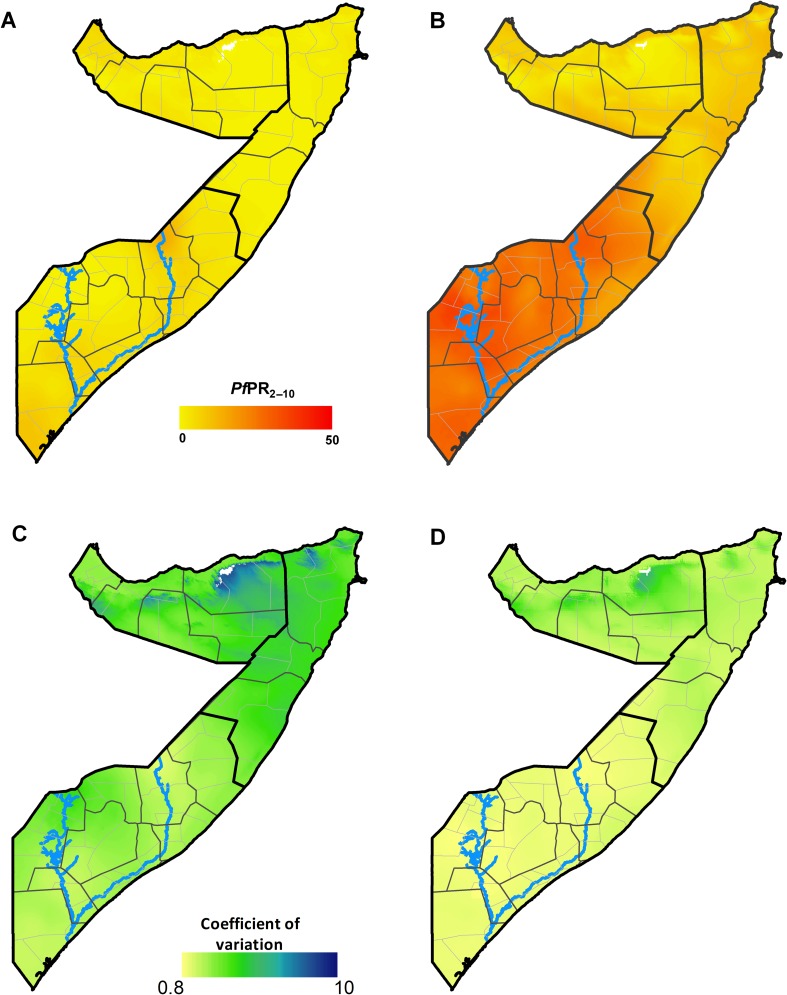
Figure 2.
(A) Map of the posterior annual mean PfPR2–10 prediction to 2010 (contemporary) at 1×1 km grid location in Somalia. (B) Map of the maximum mean PfPR2–10 prediction (receptive) at 1×1 km grid location as computed from the posterior annual mean PfPR2–10 prediction for each year from 2007 to 2010. (C) Map of the coefficient of variation (the SD/the mean PfPR2–10 prediction) of the contemporary prediction at 1×1 km grid location. (D) Map of the coefficient of variation at 1×1 km grid location of the receptive prediction. The thick black lines show the zone boundaries, the thin black lines show the regional boundaries and the thin grey lines show the district boundaries. Higher coefficient of variation of the predictions suggests higher uncertainties of the PfPR2–10 predictions. The scale bar for the continuous PfPR2–10 ends at 50, which is the upper limit of mesoendemic transmission. The blues lines show the location of the Juba (lower) and Shabelle (upper) Rivers.

