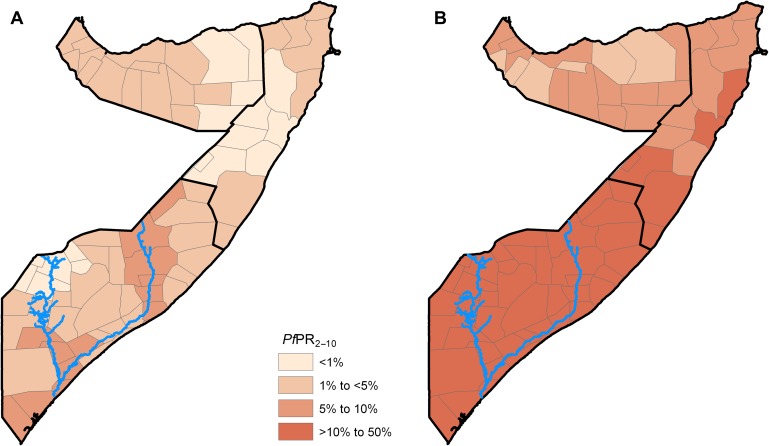
Figure 3.
District (n=74) maps of Somalia classified by endemicity using a population-weighted: (A) posterior aggregate annual mean PfPR2–10 (contemporary) prediction to 2010 and (B) the maximum annual mean PfPR2–10 (receptive) predictions over the period 2007–2010. The blues lines show the location of the Juba (lower) and Shabelle (upper) Rivers.

