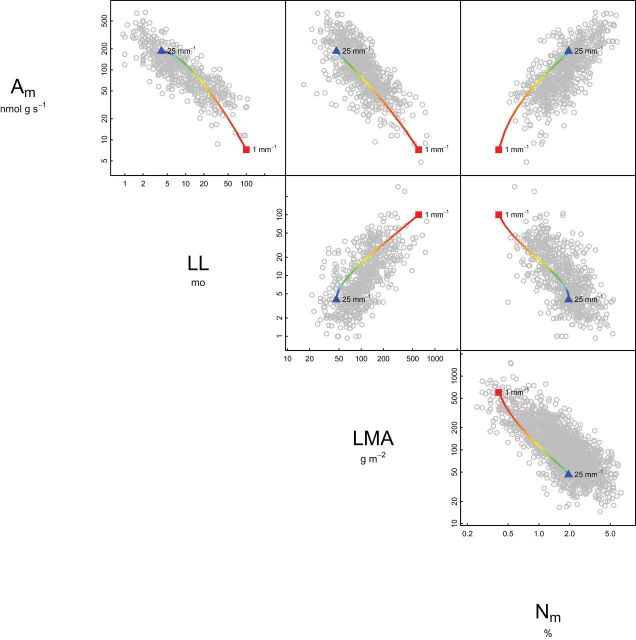
Fig. 3.
Predictions of our 2011 model are driven by variation in VD, contrary to the claims of Sack et al. (2013). This figure is redrawn from Fig. 3 of our original paper, assuming that VD×IVD=1, as for nonreticulate venation, and holding all but one model parameter (see Fig. 1) to constant values. VD was then varied across the global range. Circles indicate GLOPNET data for the worldwide leaf economics spectrum (LES) (Wright et al., 2004); rainbow lines beginning with red squares indicate predictions for VD=1mm–1; blue triangles indicate predictions for VD=25mm–1. Variation in VD, holding all other leaf traits constant, can account for the observed sign and slope of LES correlations. A m, mass-normalized photosynthetic rate; LES, leaf economics spectrum; LL, leaf lifespan; LMA, leaf mass per area; N m, nitrogen content; IVD, inter-vein distance; VD, vein density (this figure is available in colour at JXB online).

