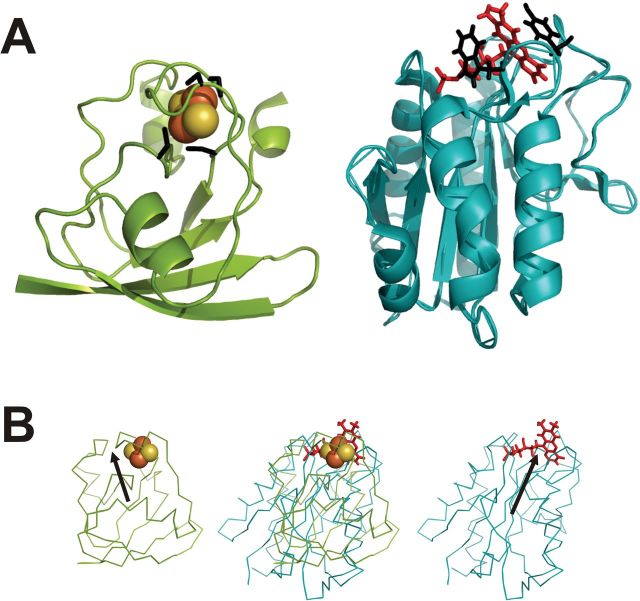
Fig. 1.
Comparative structures of Anabaena ferredoxin and flavodoxin. (A) Ribbon diagrams of Fd (left) and Fld (right) showing interactions of the prosthetic groups at the active sites. The Fe–S cluster of Fd is represented as red-orange balls, and the FMN of Fld as red sticks. The side chains of the binding cysteines of Fd and of the stacking aromatic amino acids of Fld are coloured as black sticks. (B) Fd and Fld can be compared on the basis of their surface electrostatic potentials. The left and right panels show the Anabaena Fd and Fld, respectively, as Cα-traces. Prosthetic groups are highlighted. The two proteins are aligned according to the procedure derived by Ullmann et al. (2000). In the central picture, the structures are superimposed, showing co-localization of the redox centres. For clarity reasons, the vectors corresponding to the dipolar moments (black arrows) are drawn from positive to negative, opposite to conventional representations.

