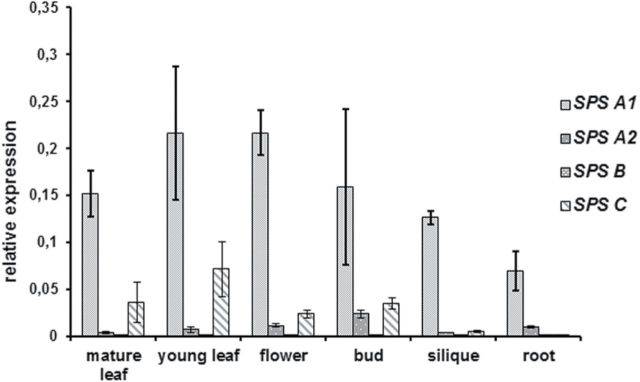
Fig. 3.

Real-time quantitative PCR analysis of SPS isoform expression in different tissues of Arabidopsis plants. Transcript levels are expressed as a percentage of the transcript level of ubiquitin 10 (At4g05320) in the same organ. Values are the means ±SD and of three replicates. All samples were taken from plants grown in soil under short-day conditions for 3–6 weeks, except those representing reproductive tissues which were taken from plants grown under long-day condtions (14h light/10h dark) for an additional 3–5 weeks. Silique samples contained seeds and represented a full range of developmental stages. All samples were taken in the middle of the photoperiod.
