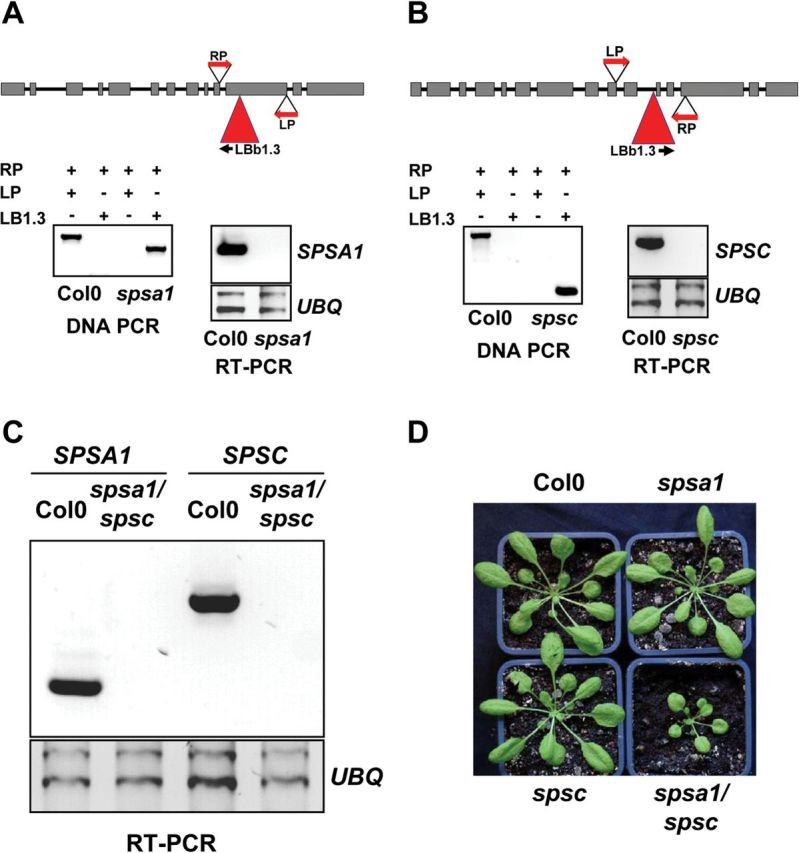
Fig. 4.

Molecular analysis of the SPS Arabidopsis knock-out and the mutants analysed in this study. (A and B) spsa1 and spsc single knock-outs. The T-DNA insertion sites and primer (LP, RP, and LBb1.3) locations are indicated. Expression of AtSPSA1 and AtSPSC transcripts was shown by RT-PCR with gene-specific primer sets. UBQ serves as an internal control. (C) RT-PCR analysis of SPSA1 and SPSC expression in spsa1/spsc double knock-out plants with UBQ serving as an internal control. (D) Growth phenotype of 6-week-old SPS knock-out mutants compared with the Col-0 wild-type control. Plants were cultivated under short-day conditions with 8h light/16h dark. (This figure is available in colour at JXB online.)
