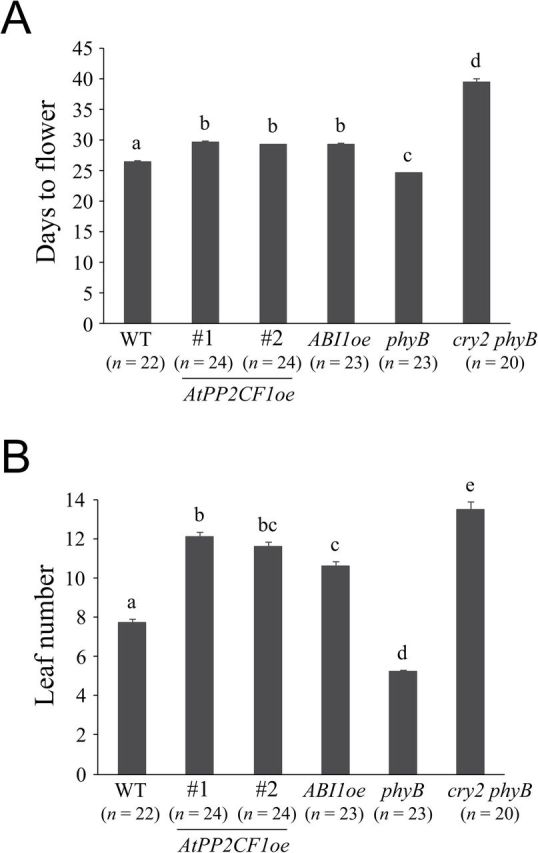
Fig. 7.

Flowering time of AtPP2CF1oe, ABI1oe, phyB, and cry2 phyB plants. Flowering time was determined by counting the days to flower (A) and leaf number (B). Values represent the mean ± SE. Different letters above bars indicate statistically significant differences between the lines, assessed by one-way ANOVA with Tukey-Kramer multiple comparison tests at P < 0.01.
