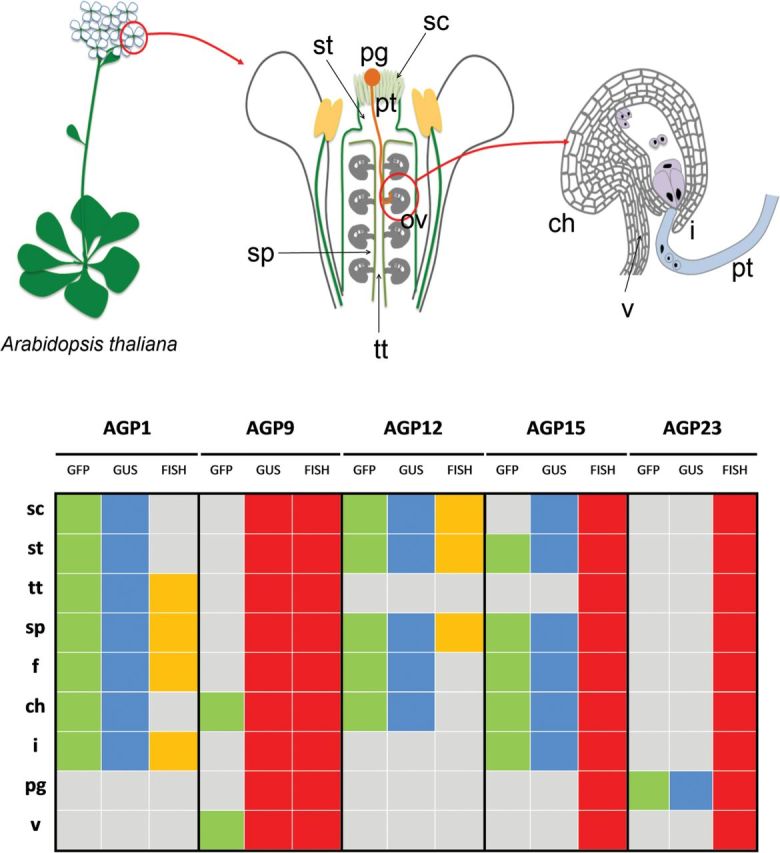
Fig. 6.

A schematic representation of the reproductive structures and tissues of A. thaliana and the distribution of the five AGPs analysed in this study throughout the different tissues, regarding the different techniques used. GFP presence, green; GUS presence, blue; FISH positive, yellow; experiment not performed, red; absence of signal, grey. ch, Chalaza; f, funiculus; i, integuments; pg, pollen grain; sc, stigmatic cell; sp, septum; st, style; tt, transmitting tract; v, vasculature.
