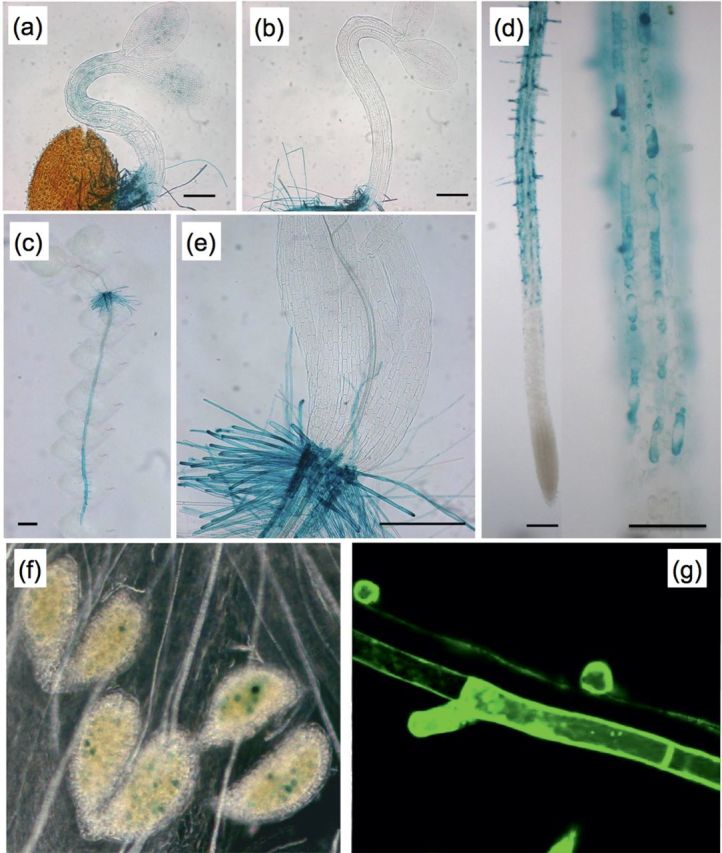
Fig. 2.

Expression analysis of At5g05500 using promoter–reporter lines. Bright-field images showing (a) faint GUS activity in a young etiolated hypocotyl, (b) absent GUS activity in a young etiolated hypocotyl where fast cell expansion has started, (c) enrichment in the root of a whole seedling, (d) trichoblast-specific expression in a root and in its close-up, (e) expression in root hairs at the collet, (f) expression in pollen. (g) represents a confocal image of promoter-driven GFP in the trichoblast cell files only. Scale bars are 200 μm in (a, b, and e), 100 μm in (d), and 1mm in (c).
