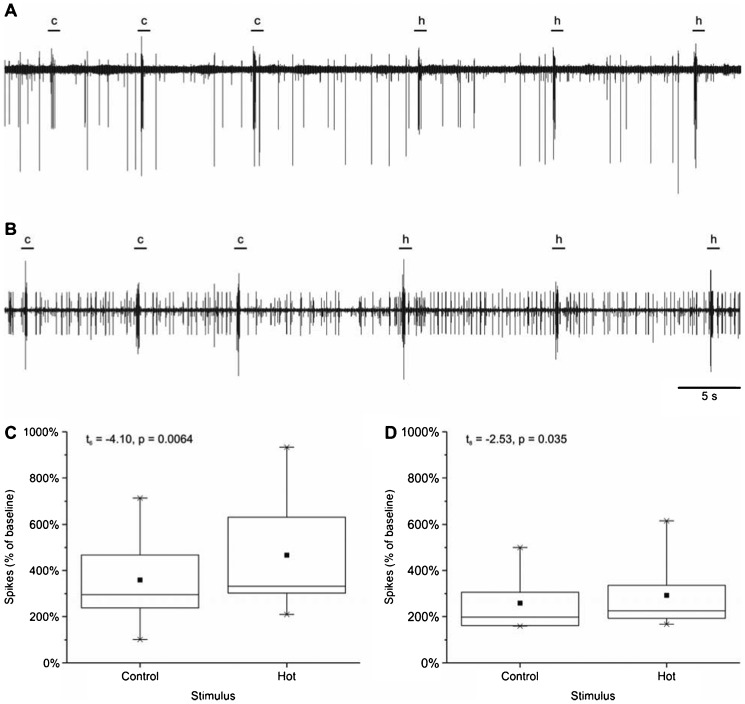
Fig. 2. Physiology of neurons in antenna of crayfish in response to high temperature stimuli.
(A,B) Representative recordings of low-frequency baseline nerve and high-frequency baseline nerve. Bars above traces indicate approximate delivery of 100 µl saline stimulus; c = control; h = high temperature. (C,D) Increase in number of action potentials relative to baseline spontaneous activity generated in response to delivery of 100 µl of saline in (C) low-frequency baseline nerve, and (D) high-frequency baseline nerve. Dot = mean; line dividing box = median; box = 50% of data; whiskers = 95% of data; asterisks = minimum and maximum.

